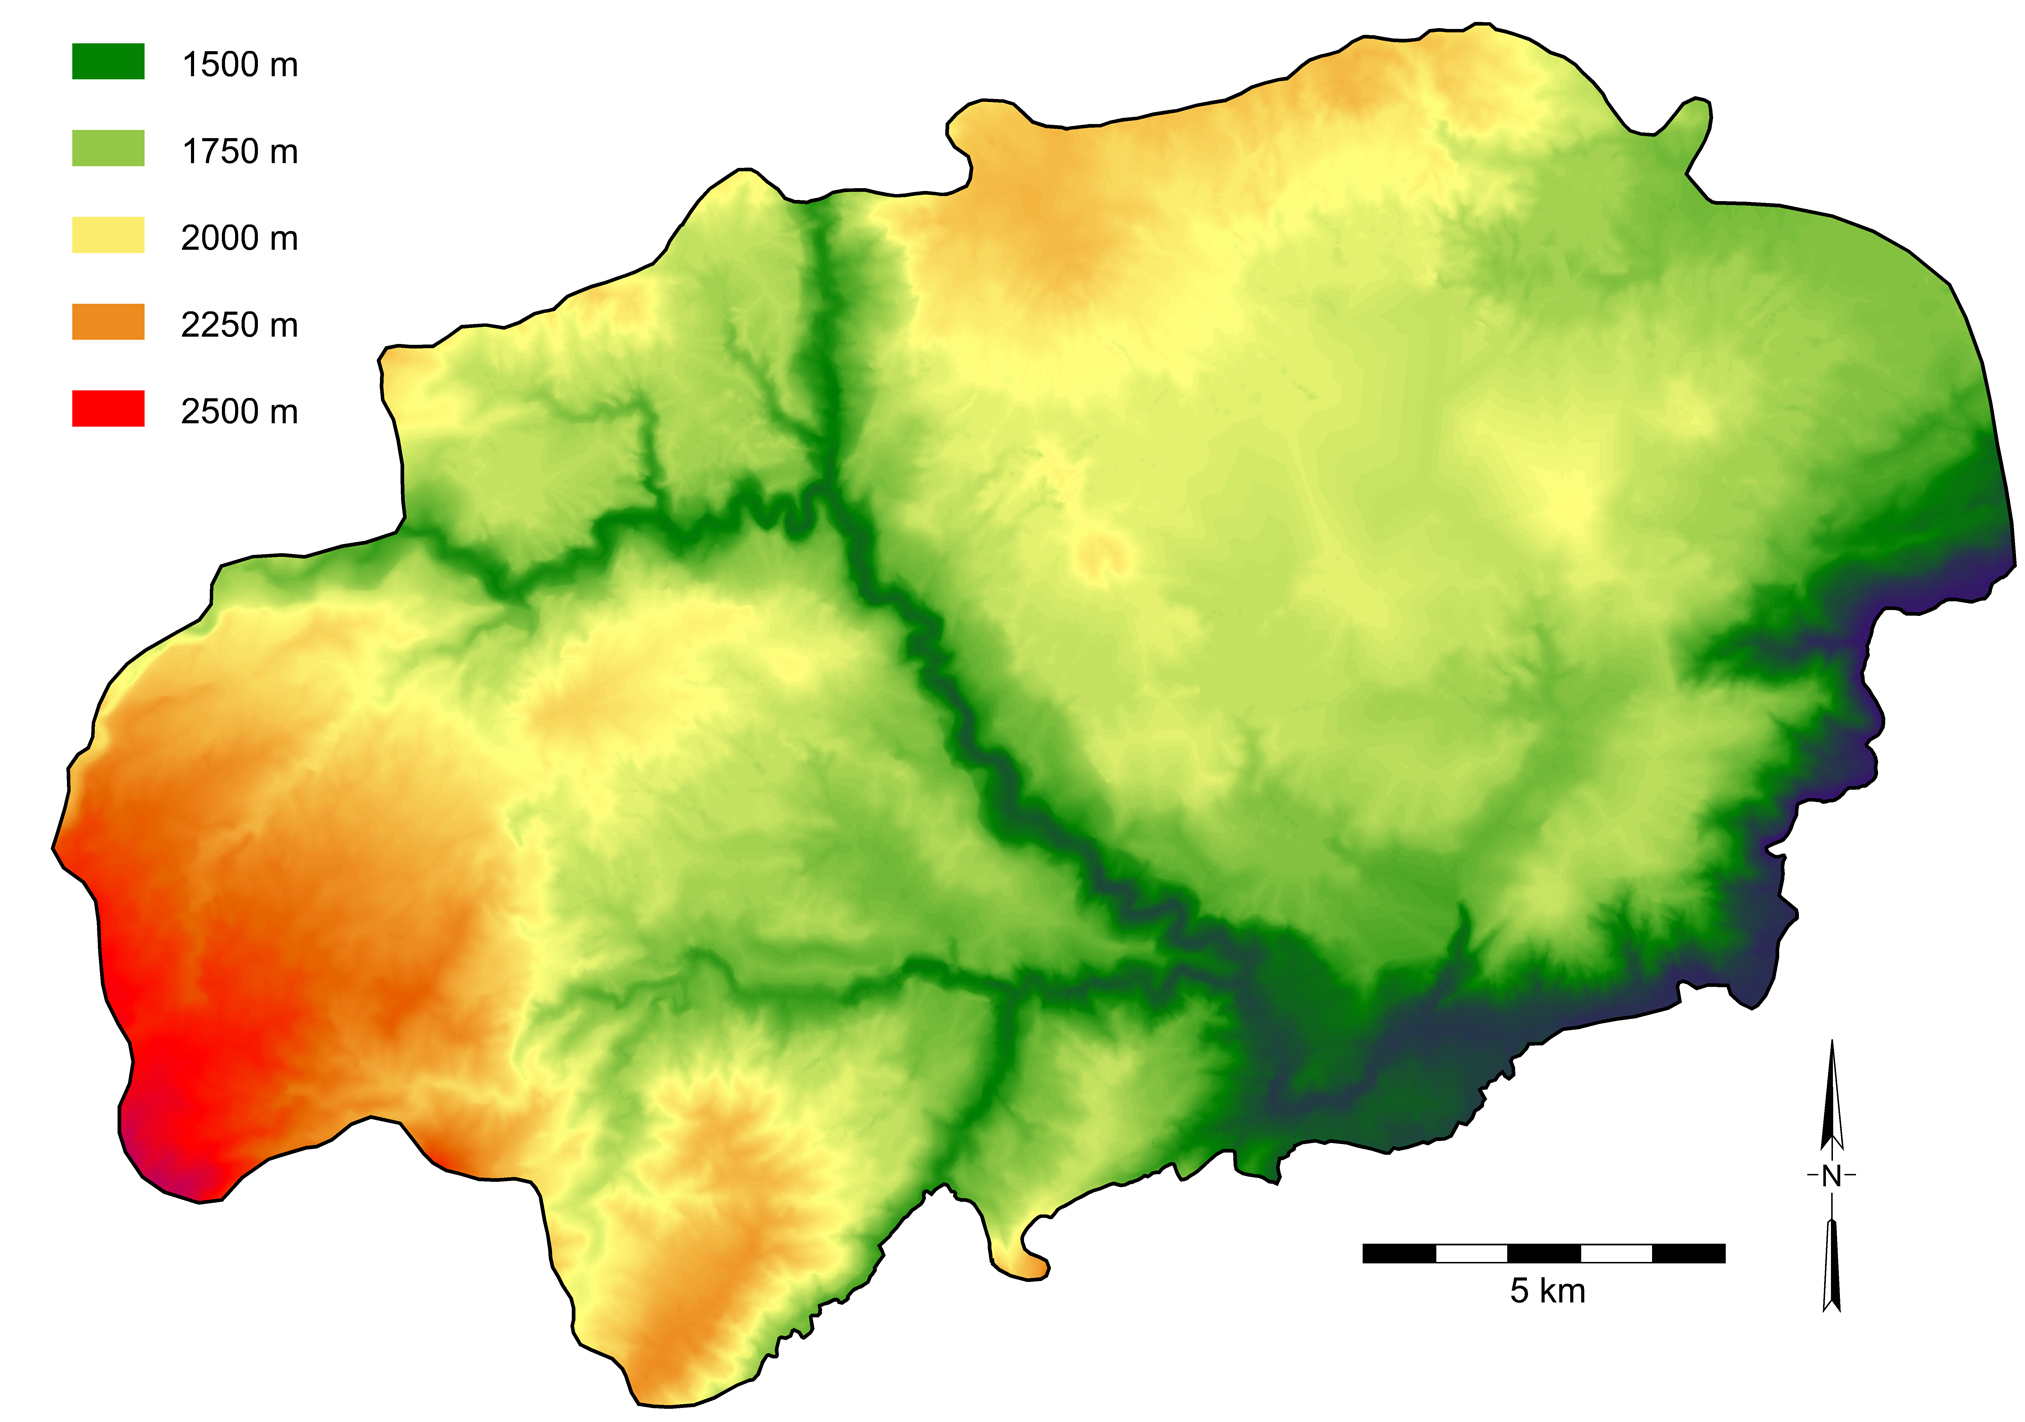
Fig. 2.2. Elevations in the San Agustín-Isnos survey zone.
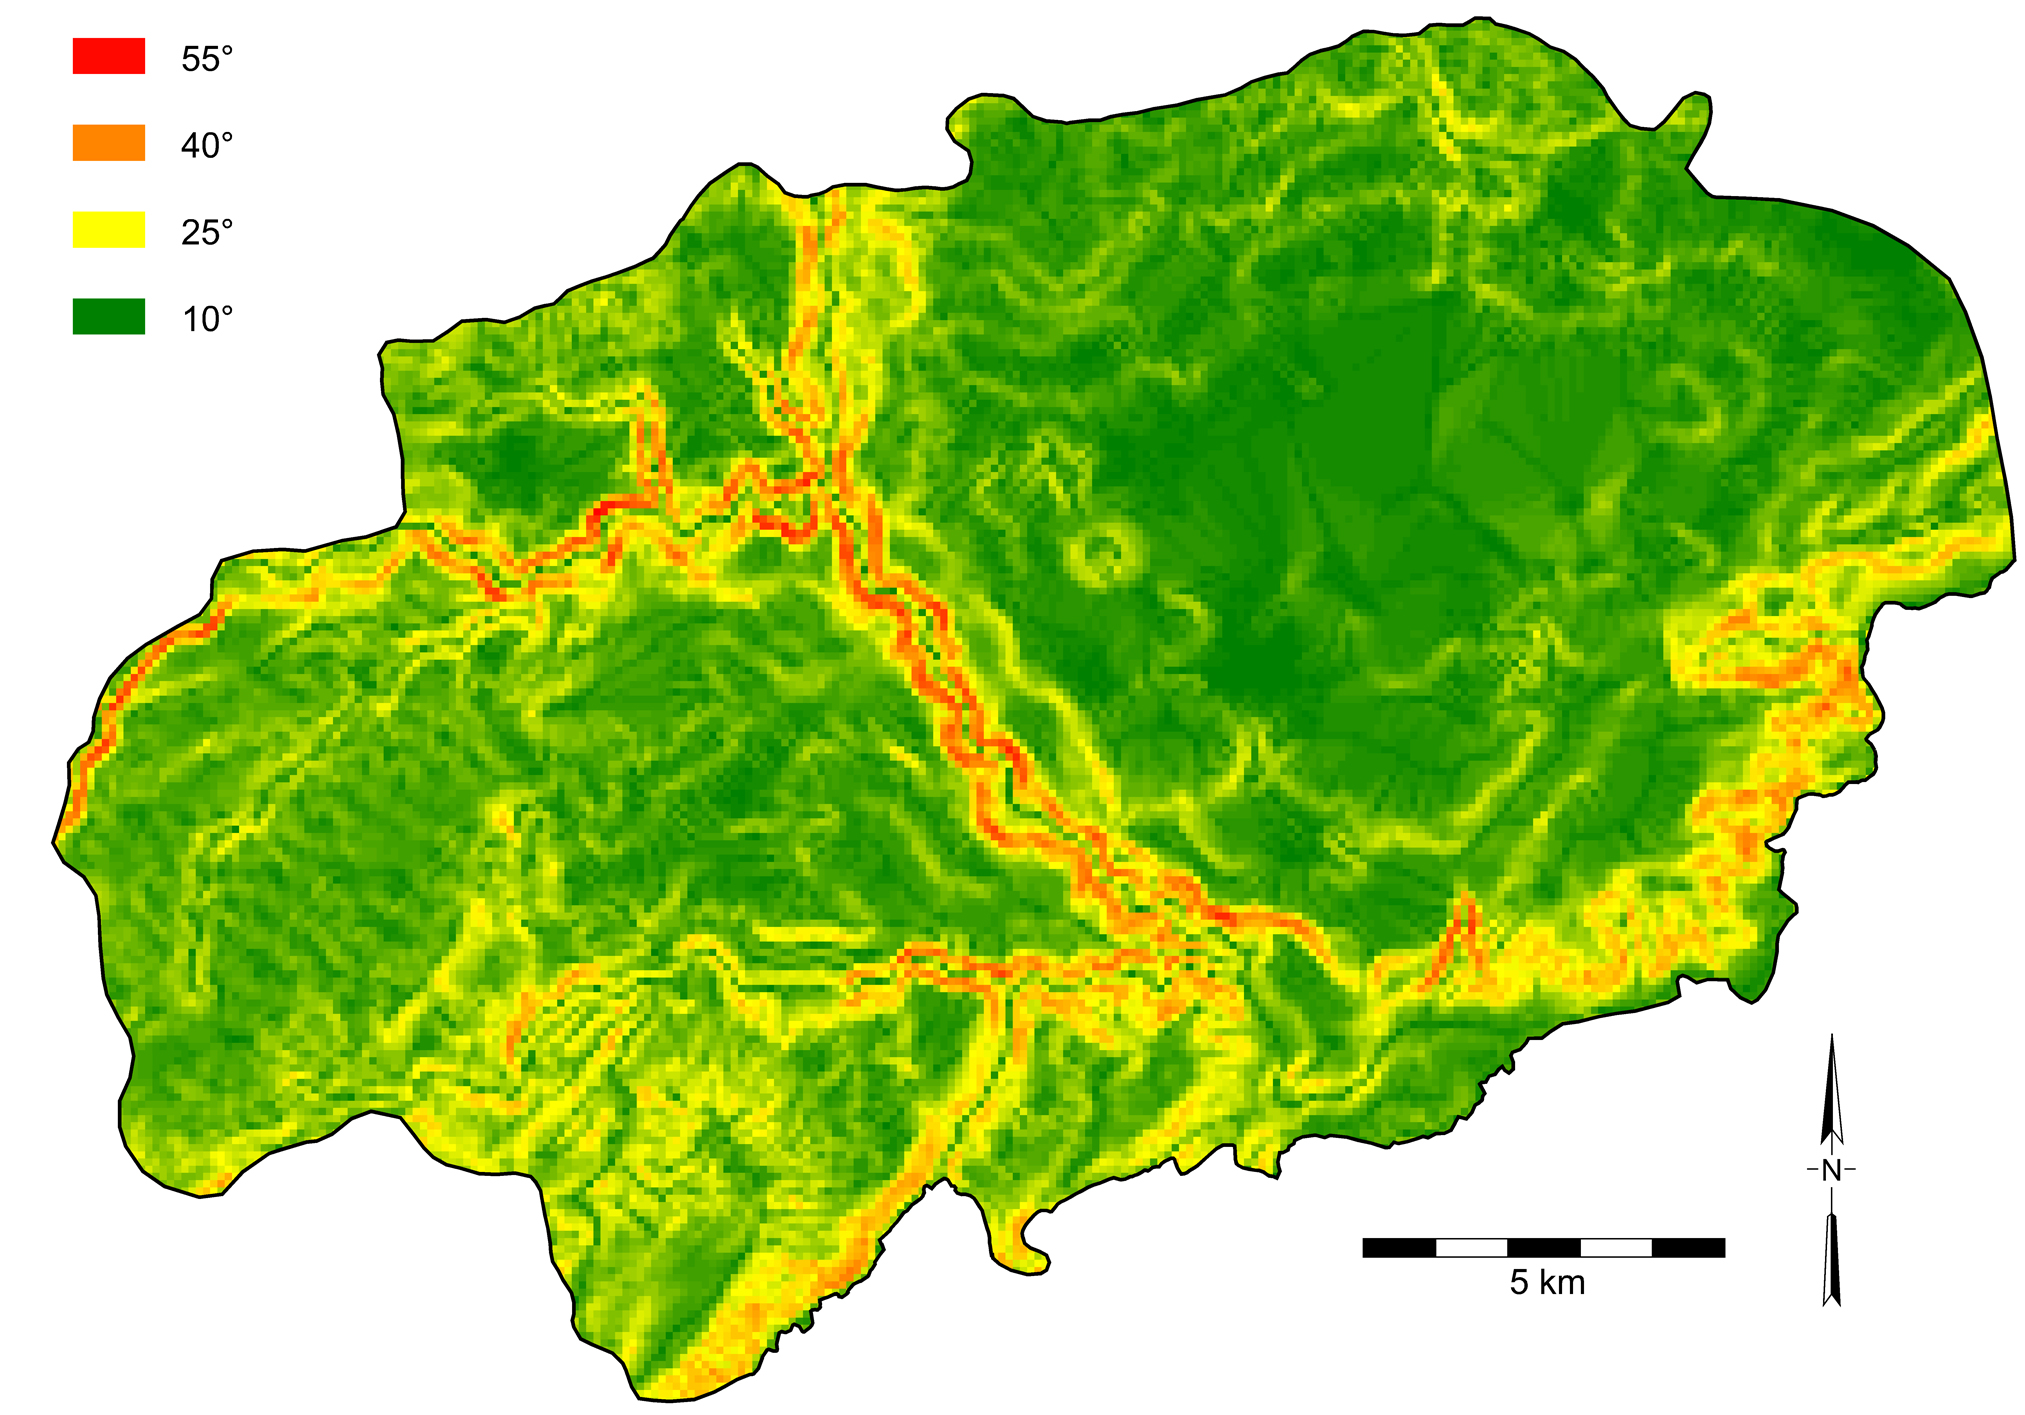
Fig. 2.5. Slopes in the San Agustín-Isnos survey zone.
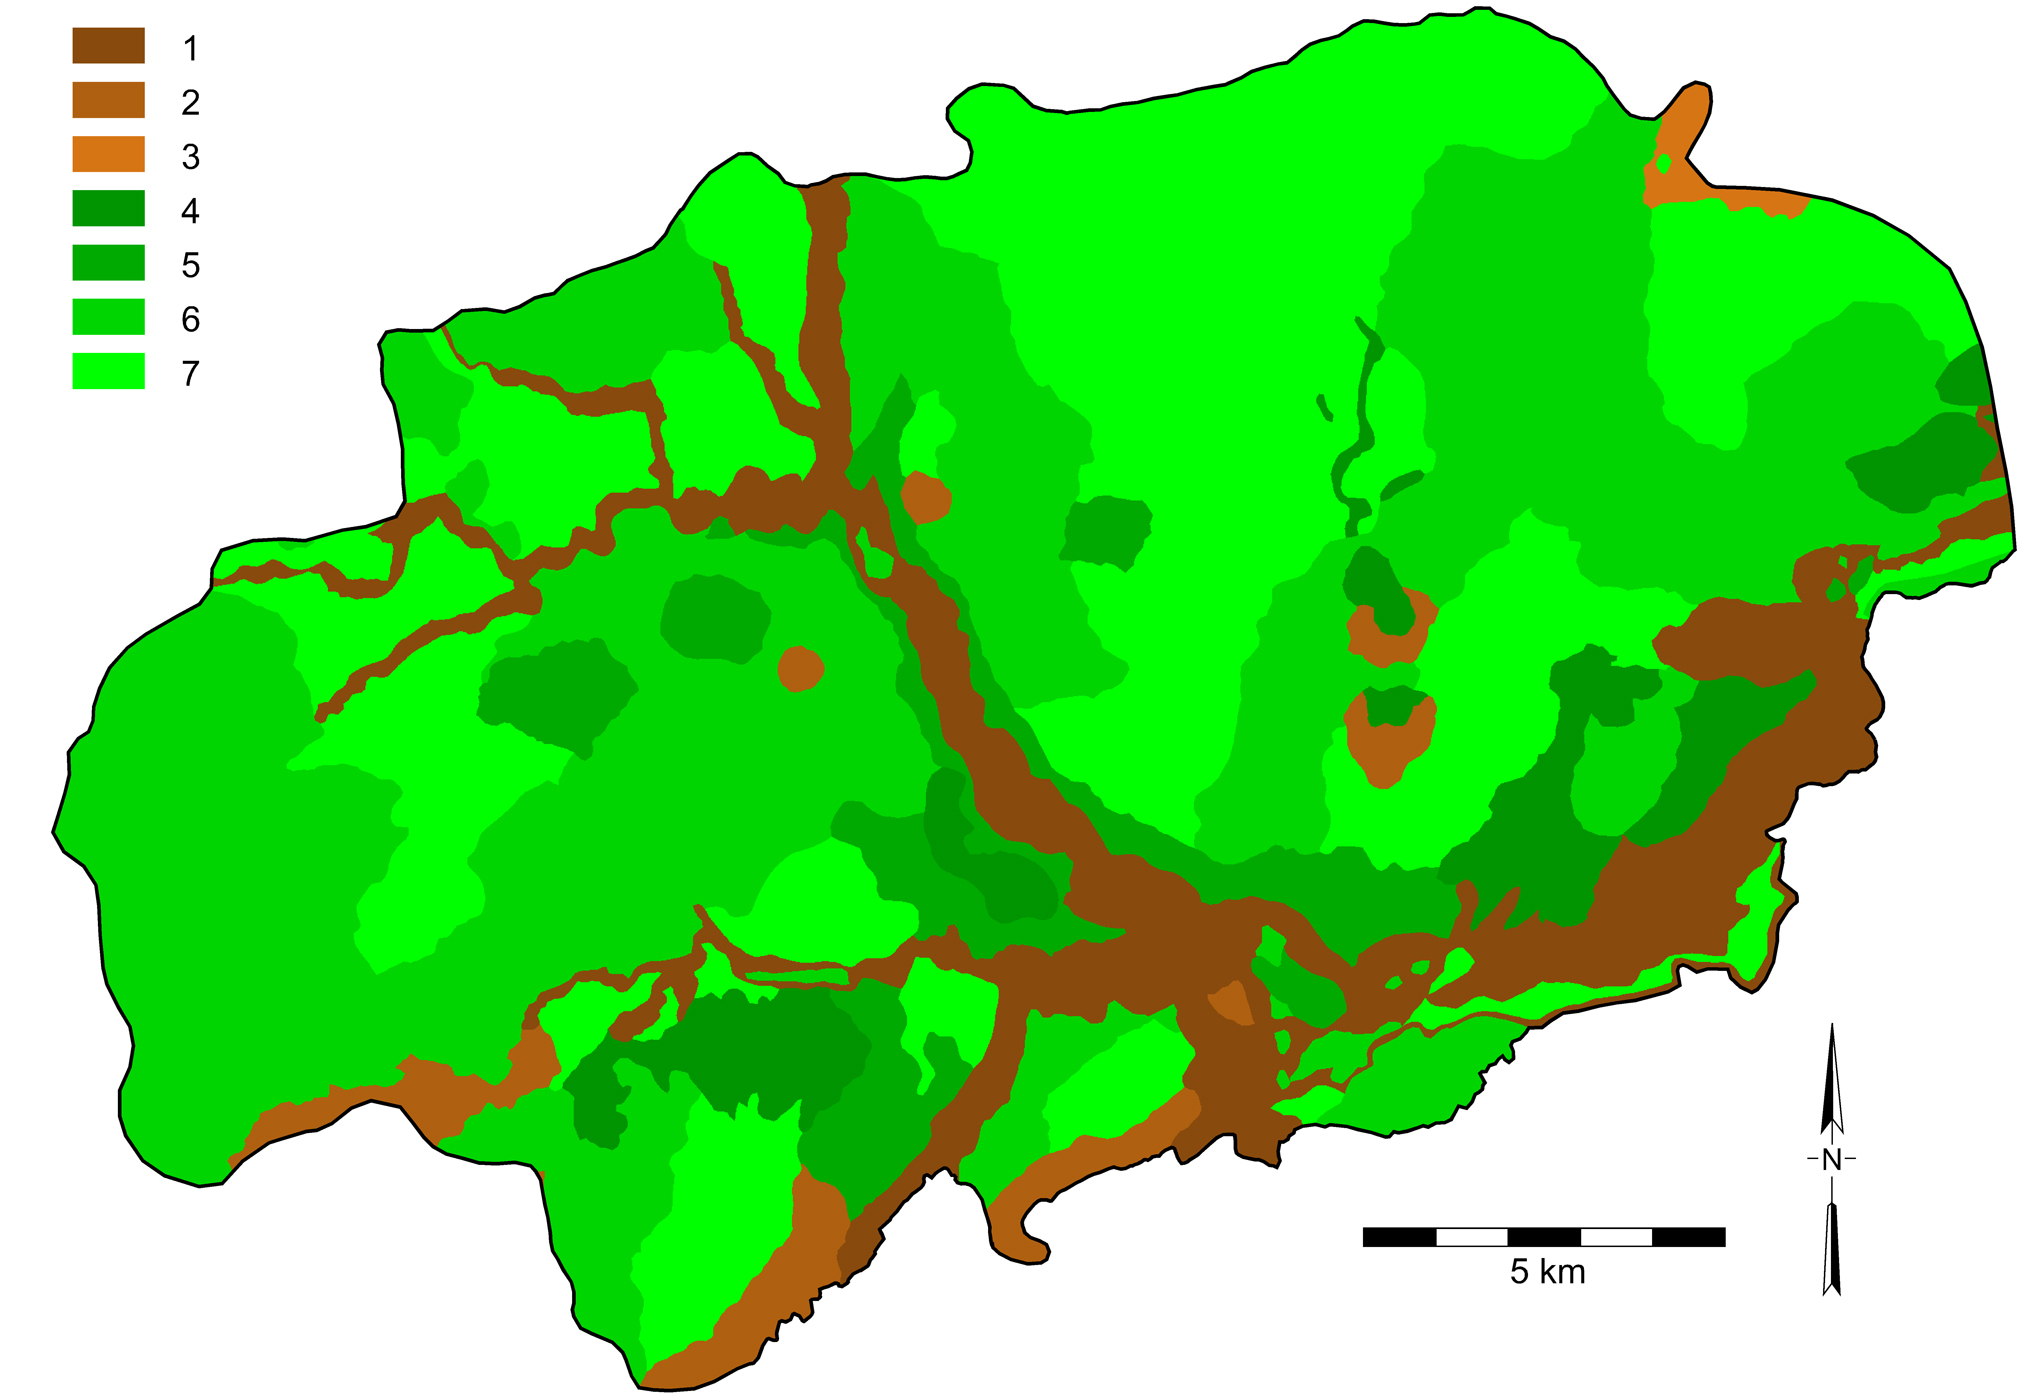
Fig. 2.9. The distribution of agricultural potential in the San Agustín-Isnos survey zone by soil class: 1 (lowest) to 7 (highest).
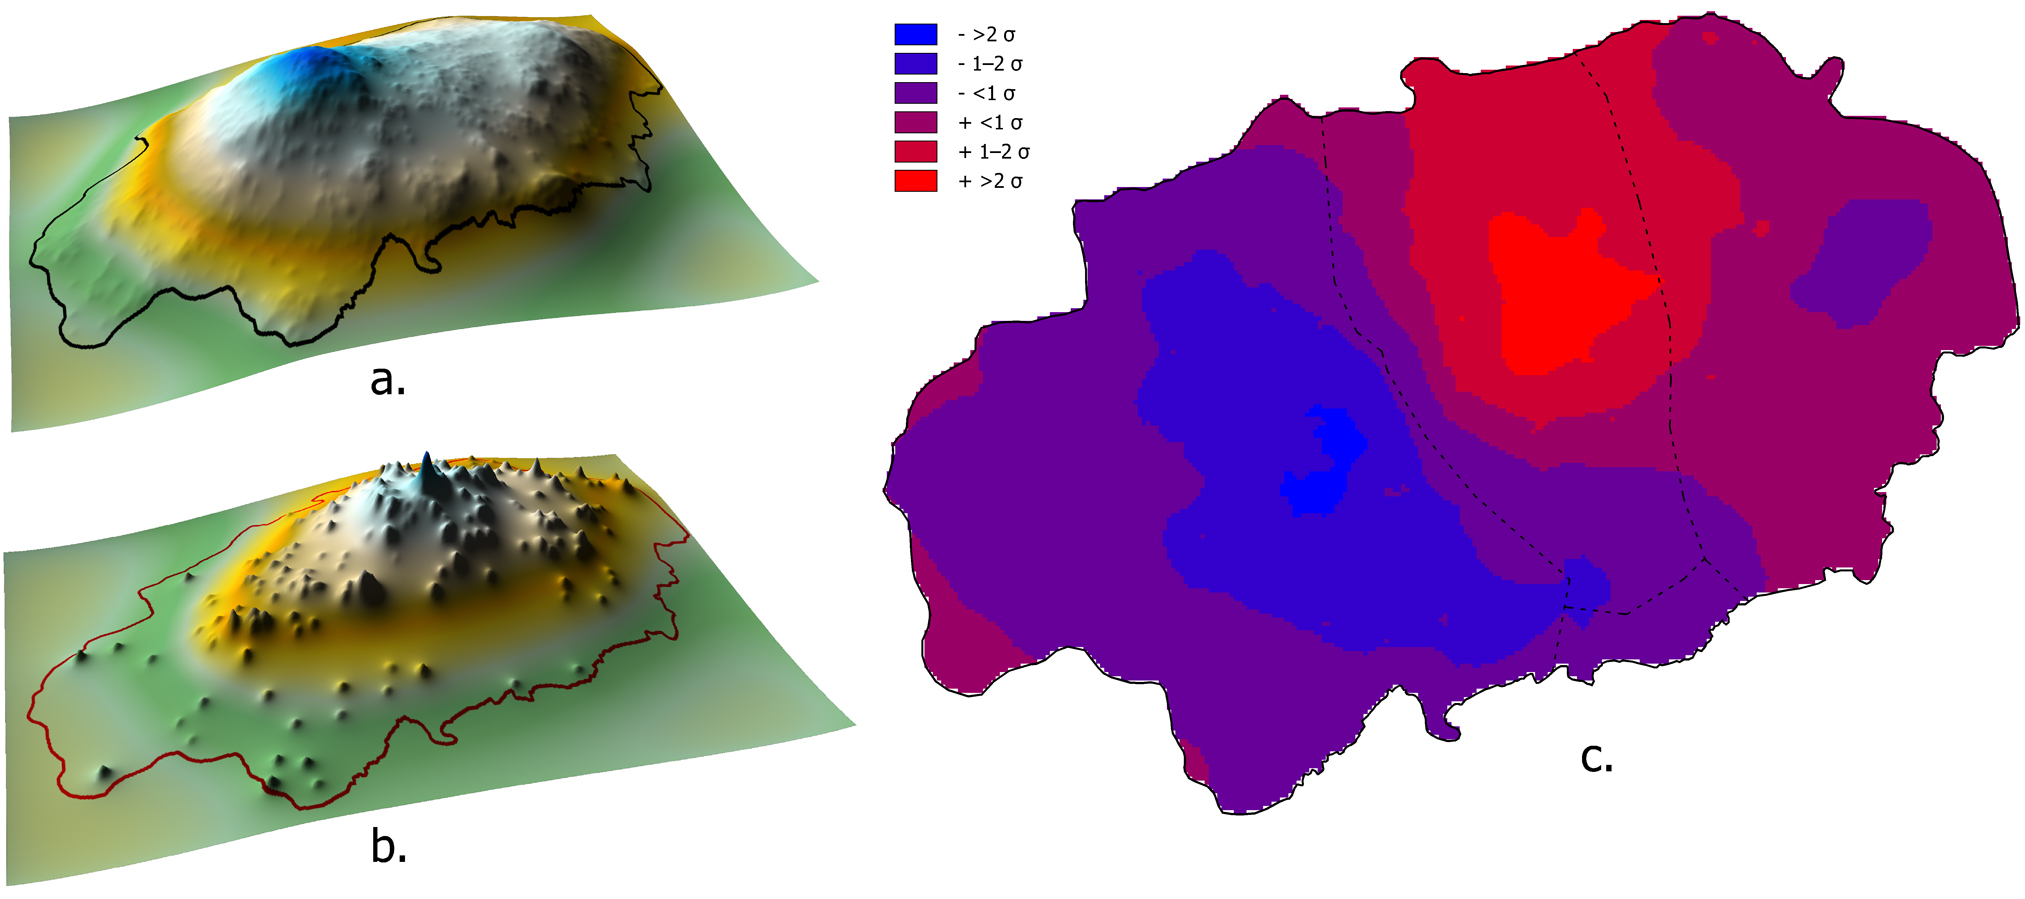
Fig. 5.6. Smoothed surfaces representing a. Regional Classic population distribution; b. Guacas Painted ceramics distribution; and c. residuals from regression analysis predicting b. from a. In c. residuals are represented above and below the mean in three groups: less than 1 standard deviation, 1–2 standard deviations, and more than 2 standard deviations.
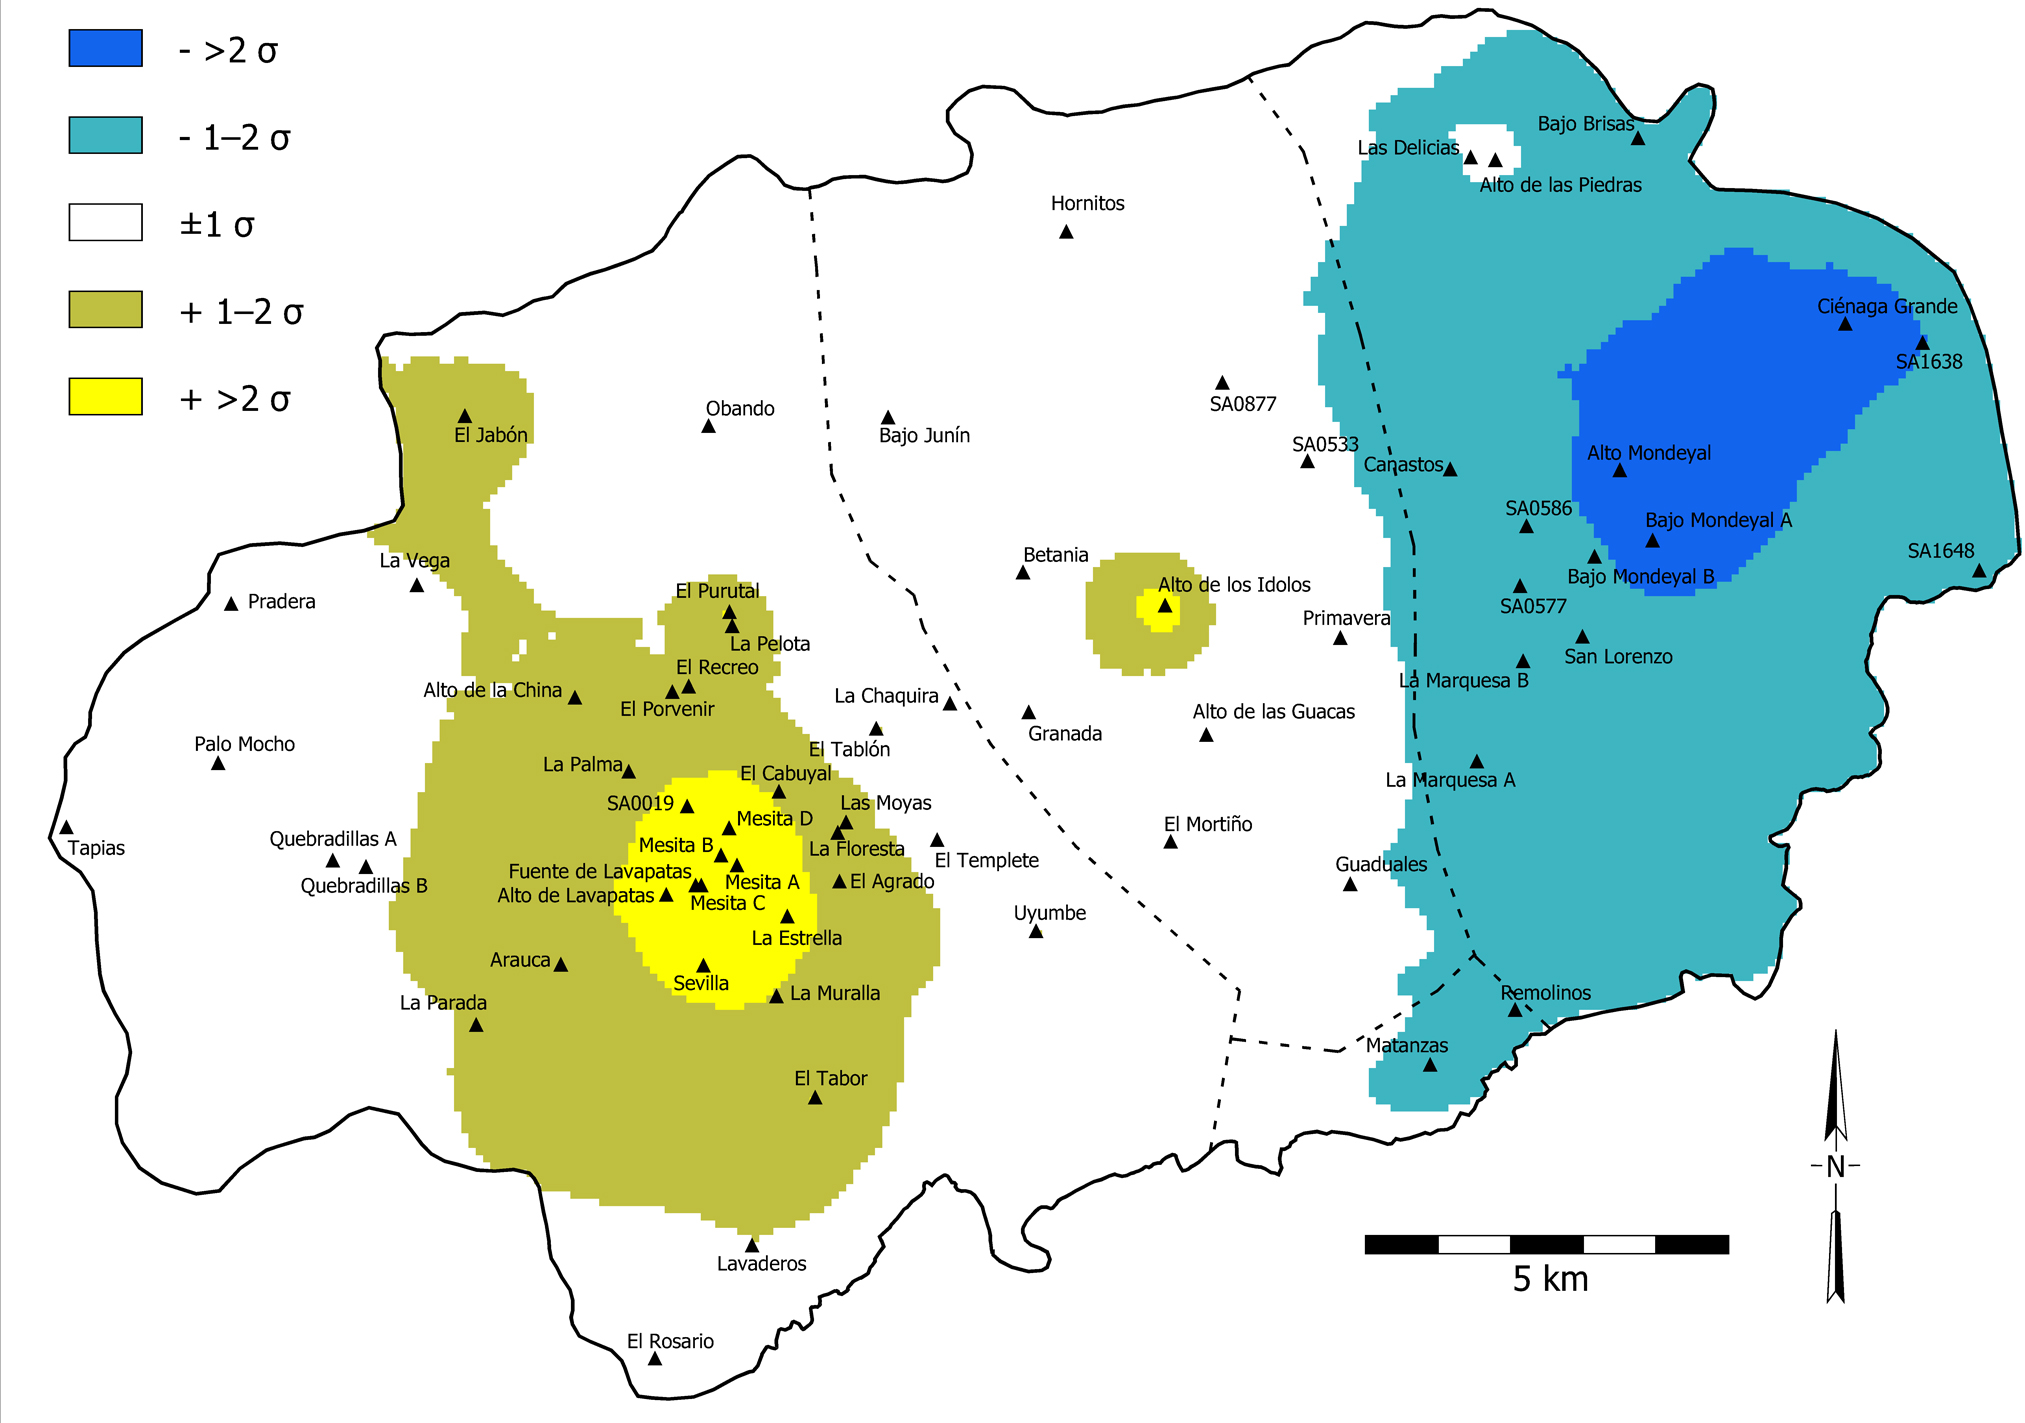
Fig. 5.17. Residuals from the regression analysis of population distribution against distribution of labor investment in monumental construction. The limits of the western, eastern and far eastern population clusters are indicated by dotted lines. Darker shading means less or much less labor investment than expected, given the population (1–2 standard deviations below the mean residual and more than 2 standard deviations below). Lighter shading means more or much more labor investment than expected, given the population (1–2 standard deviations above the mean residual and more than 2 standard deviations above).