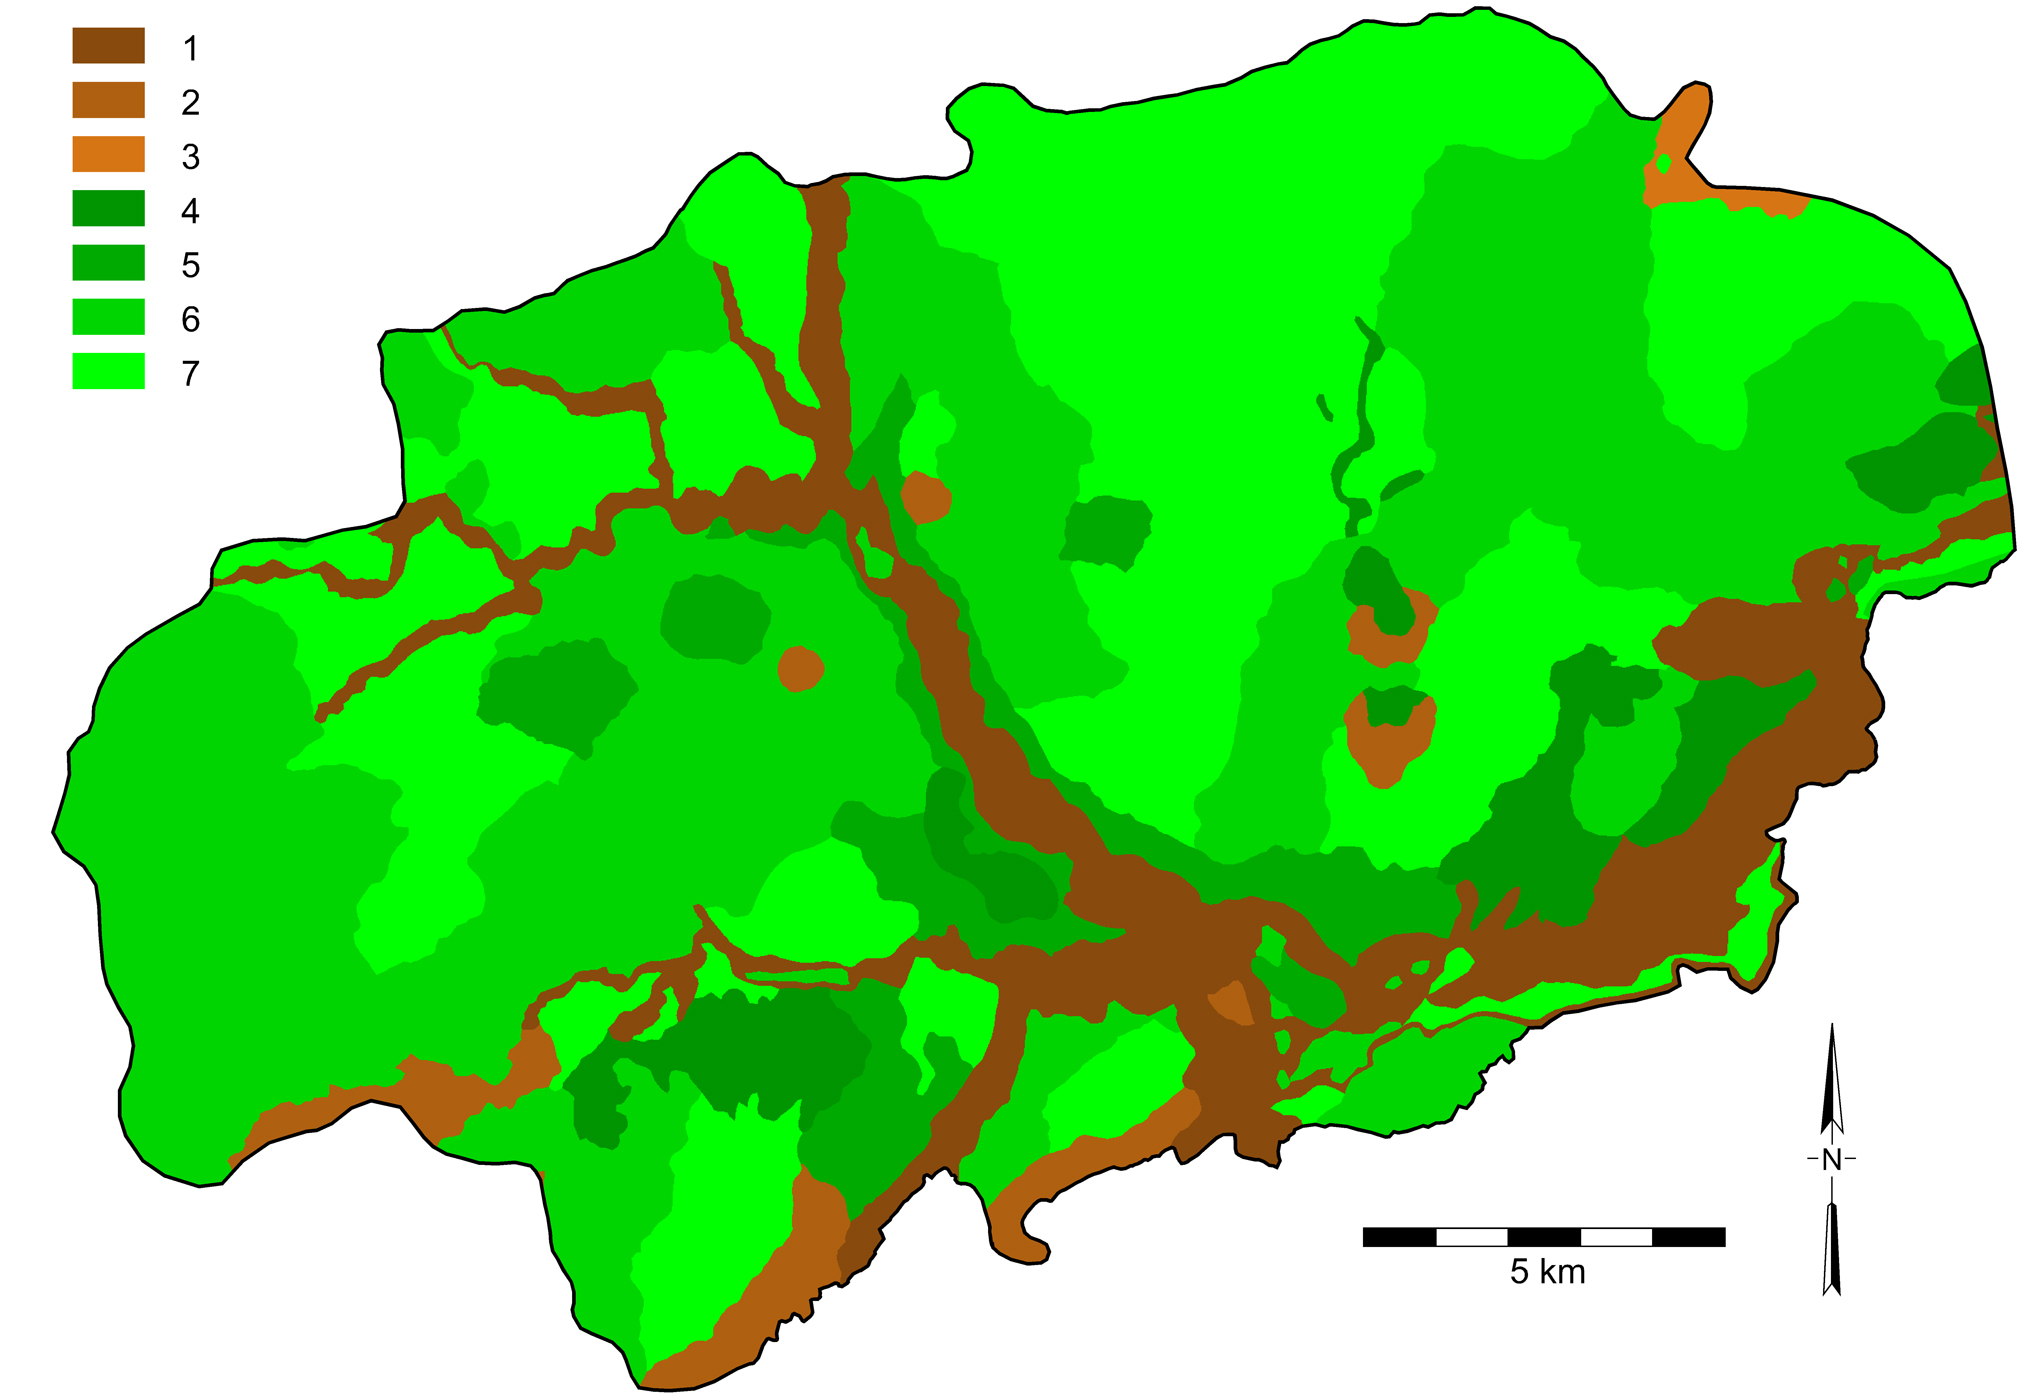
Fig. 2.9. The distribution of agricultural potential in the San Agustín-Isnos survey zone by soil class: 1 (lowest) to 7 (highest).
Return to figure list with your browser's BACK button.