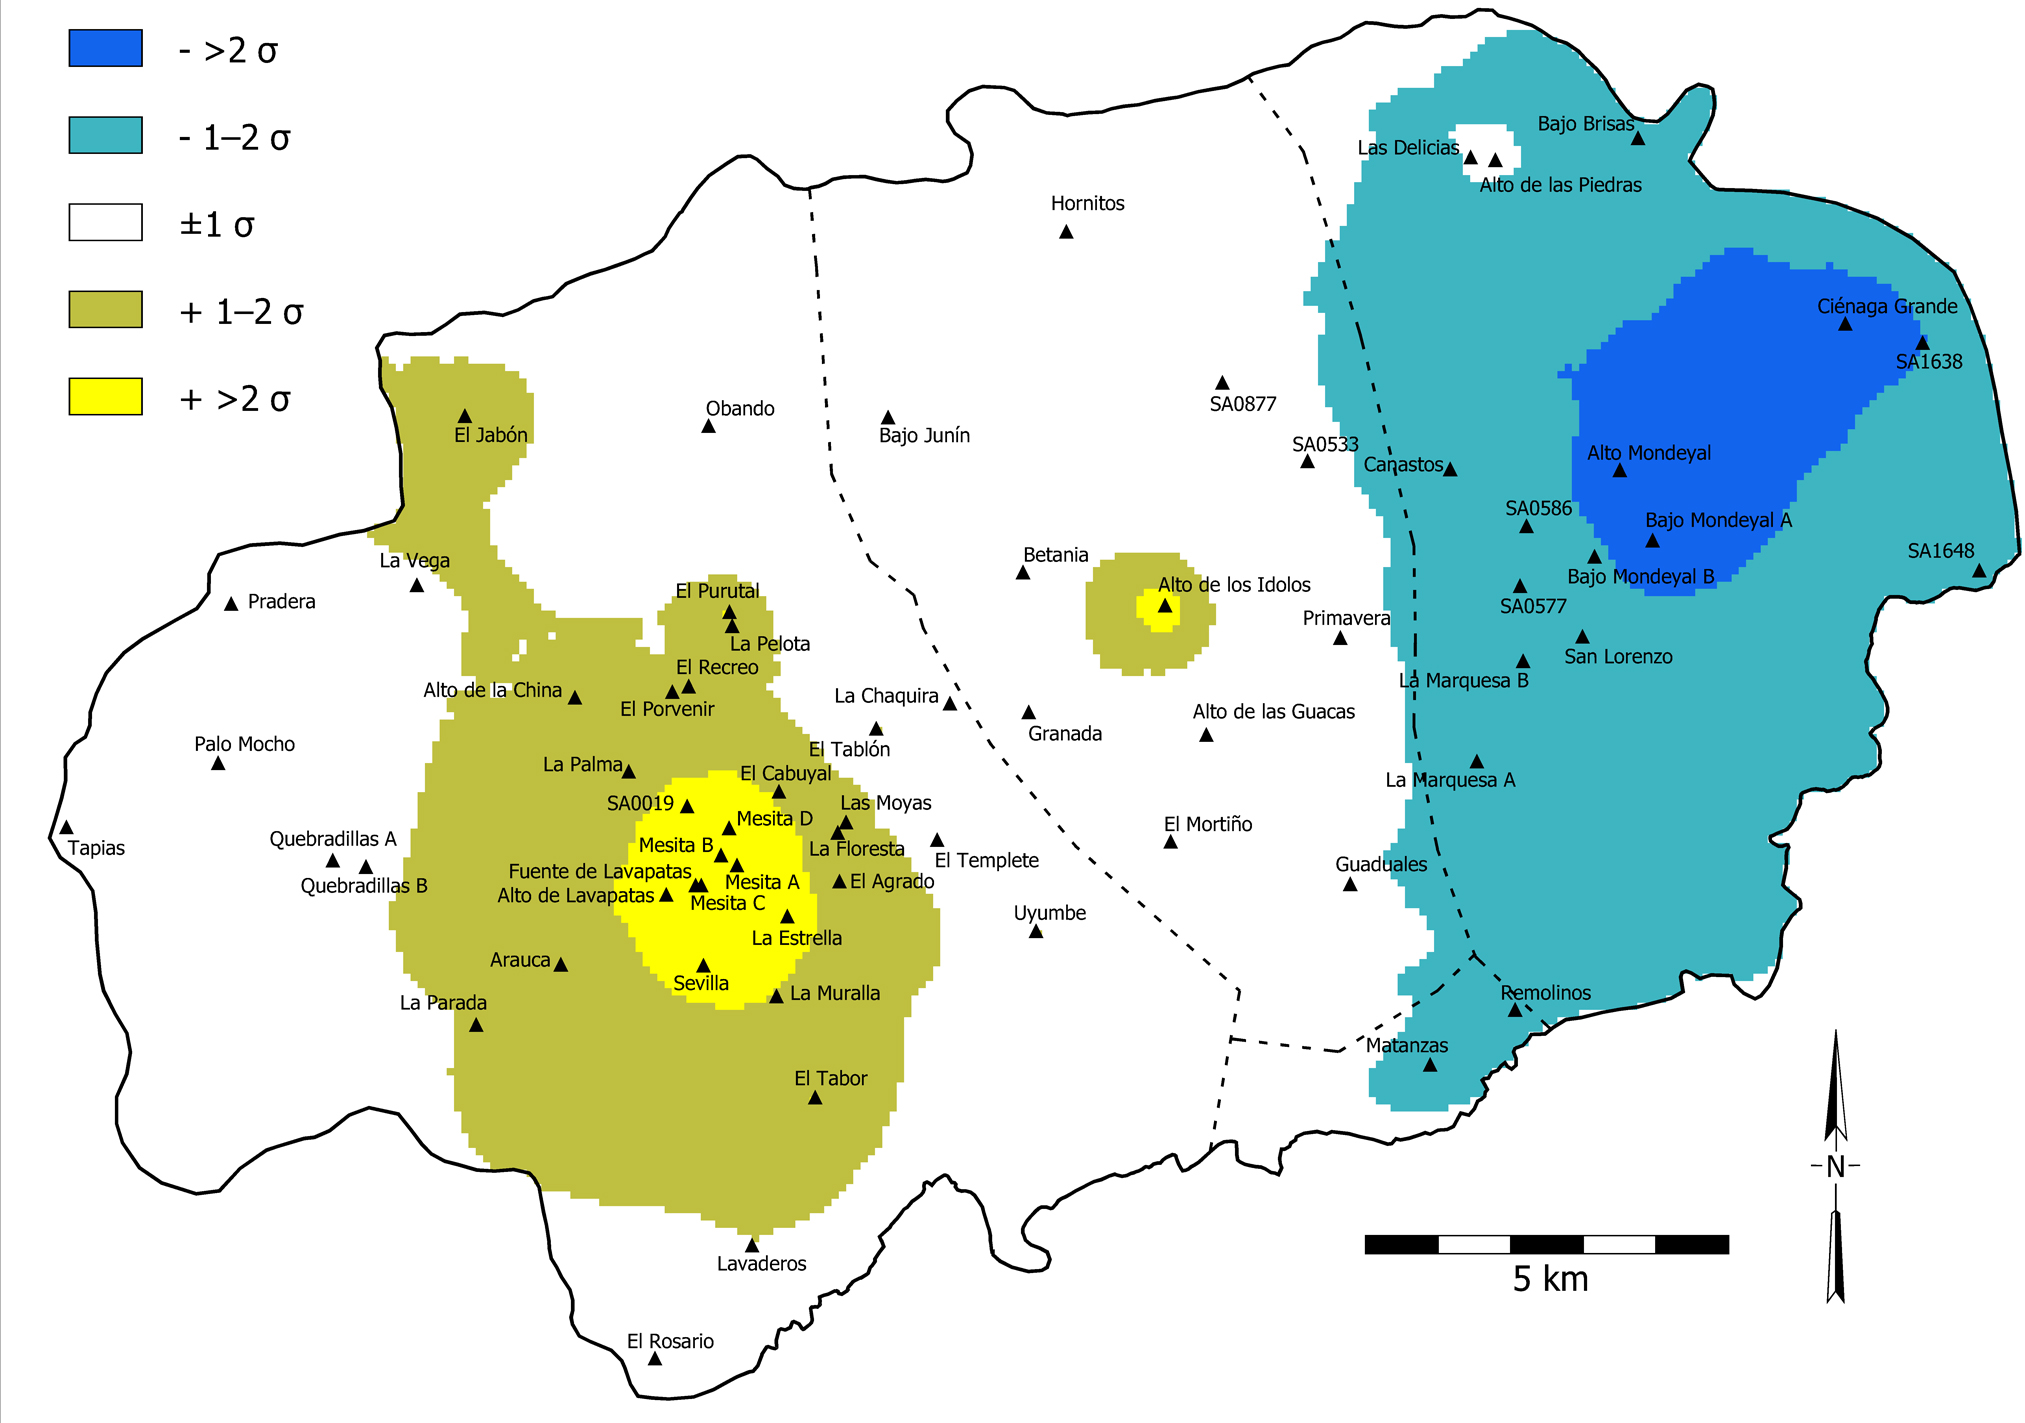
Fig. 5.17. Residuals from the regression analysis of population distribution against distribution of labor investment in monumental construction. The limits of the western, eastern and far eastern population clusters are indicated by dotted lines. Darker shading means less or much less labor investment than expected, given the population (1–2 standard deviations below the mean residual and more than 2 standard deviations below). Lighter shading means more or much more labor investment than expected, given the population (1–2 standard deviations above the mean residual and more than 2 standard deviations above).
Return to figure list with your browser's BACK button.