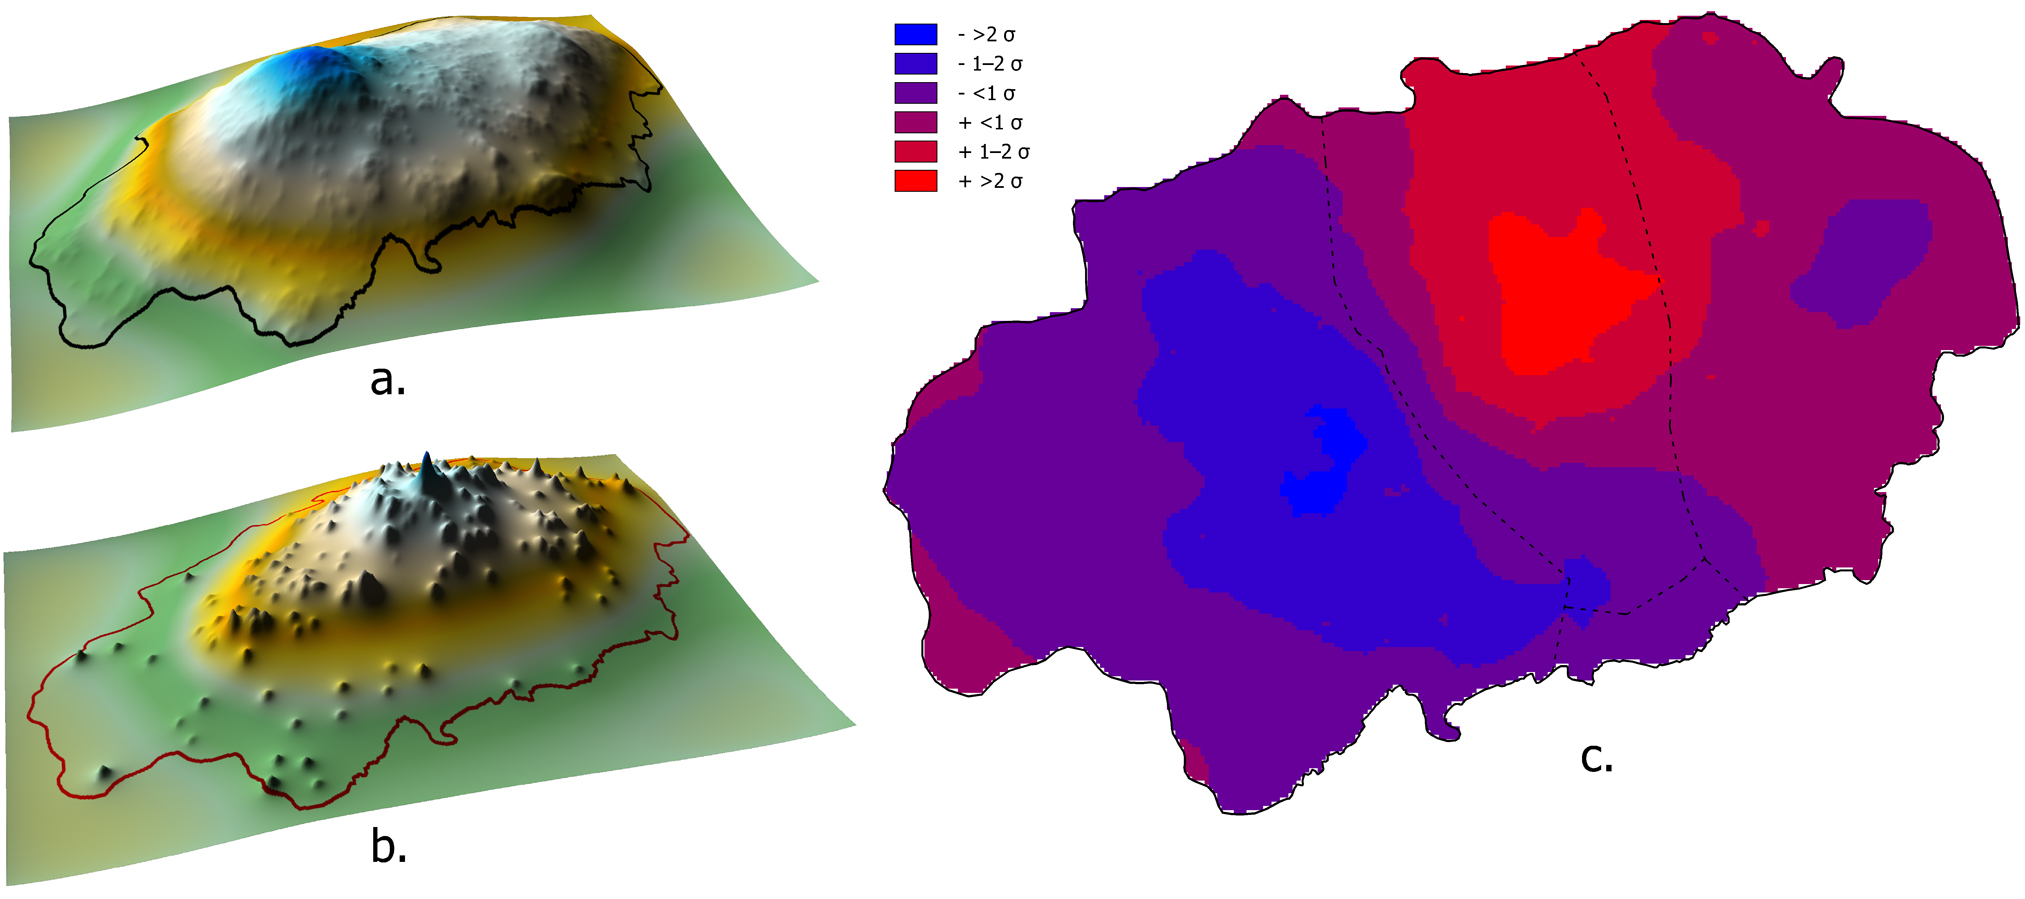
Fig. 5.6.Smoothed surfaces representing a. Regional Classic population distribution; b. Guacas Painted ceramics distribution; and c. residuals from regression analysis predicting b. from a. In c. residuals are represented above and below the mean in three groups: less than 1 standard deviation, 1–2 standard deviations, and more than 2 standard deviations.
Return to figure list with your browser's BACK button.