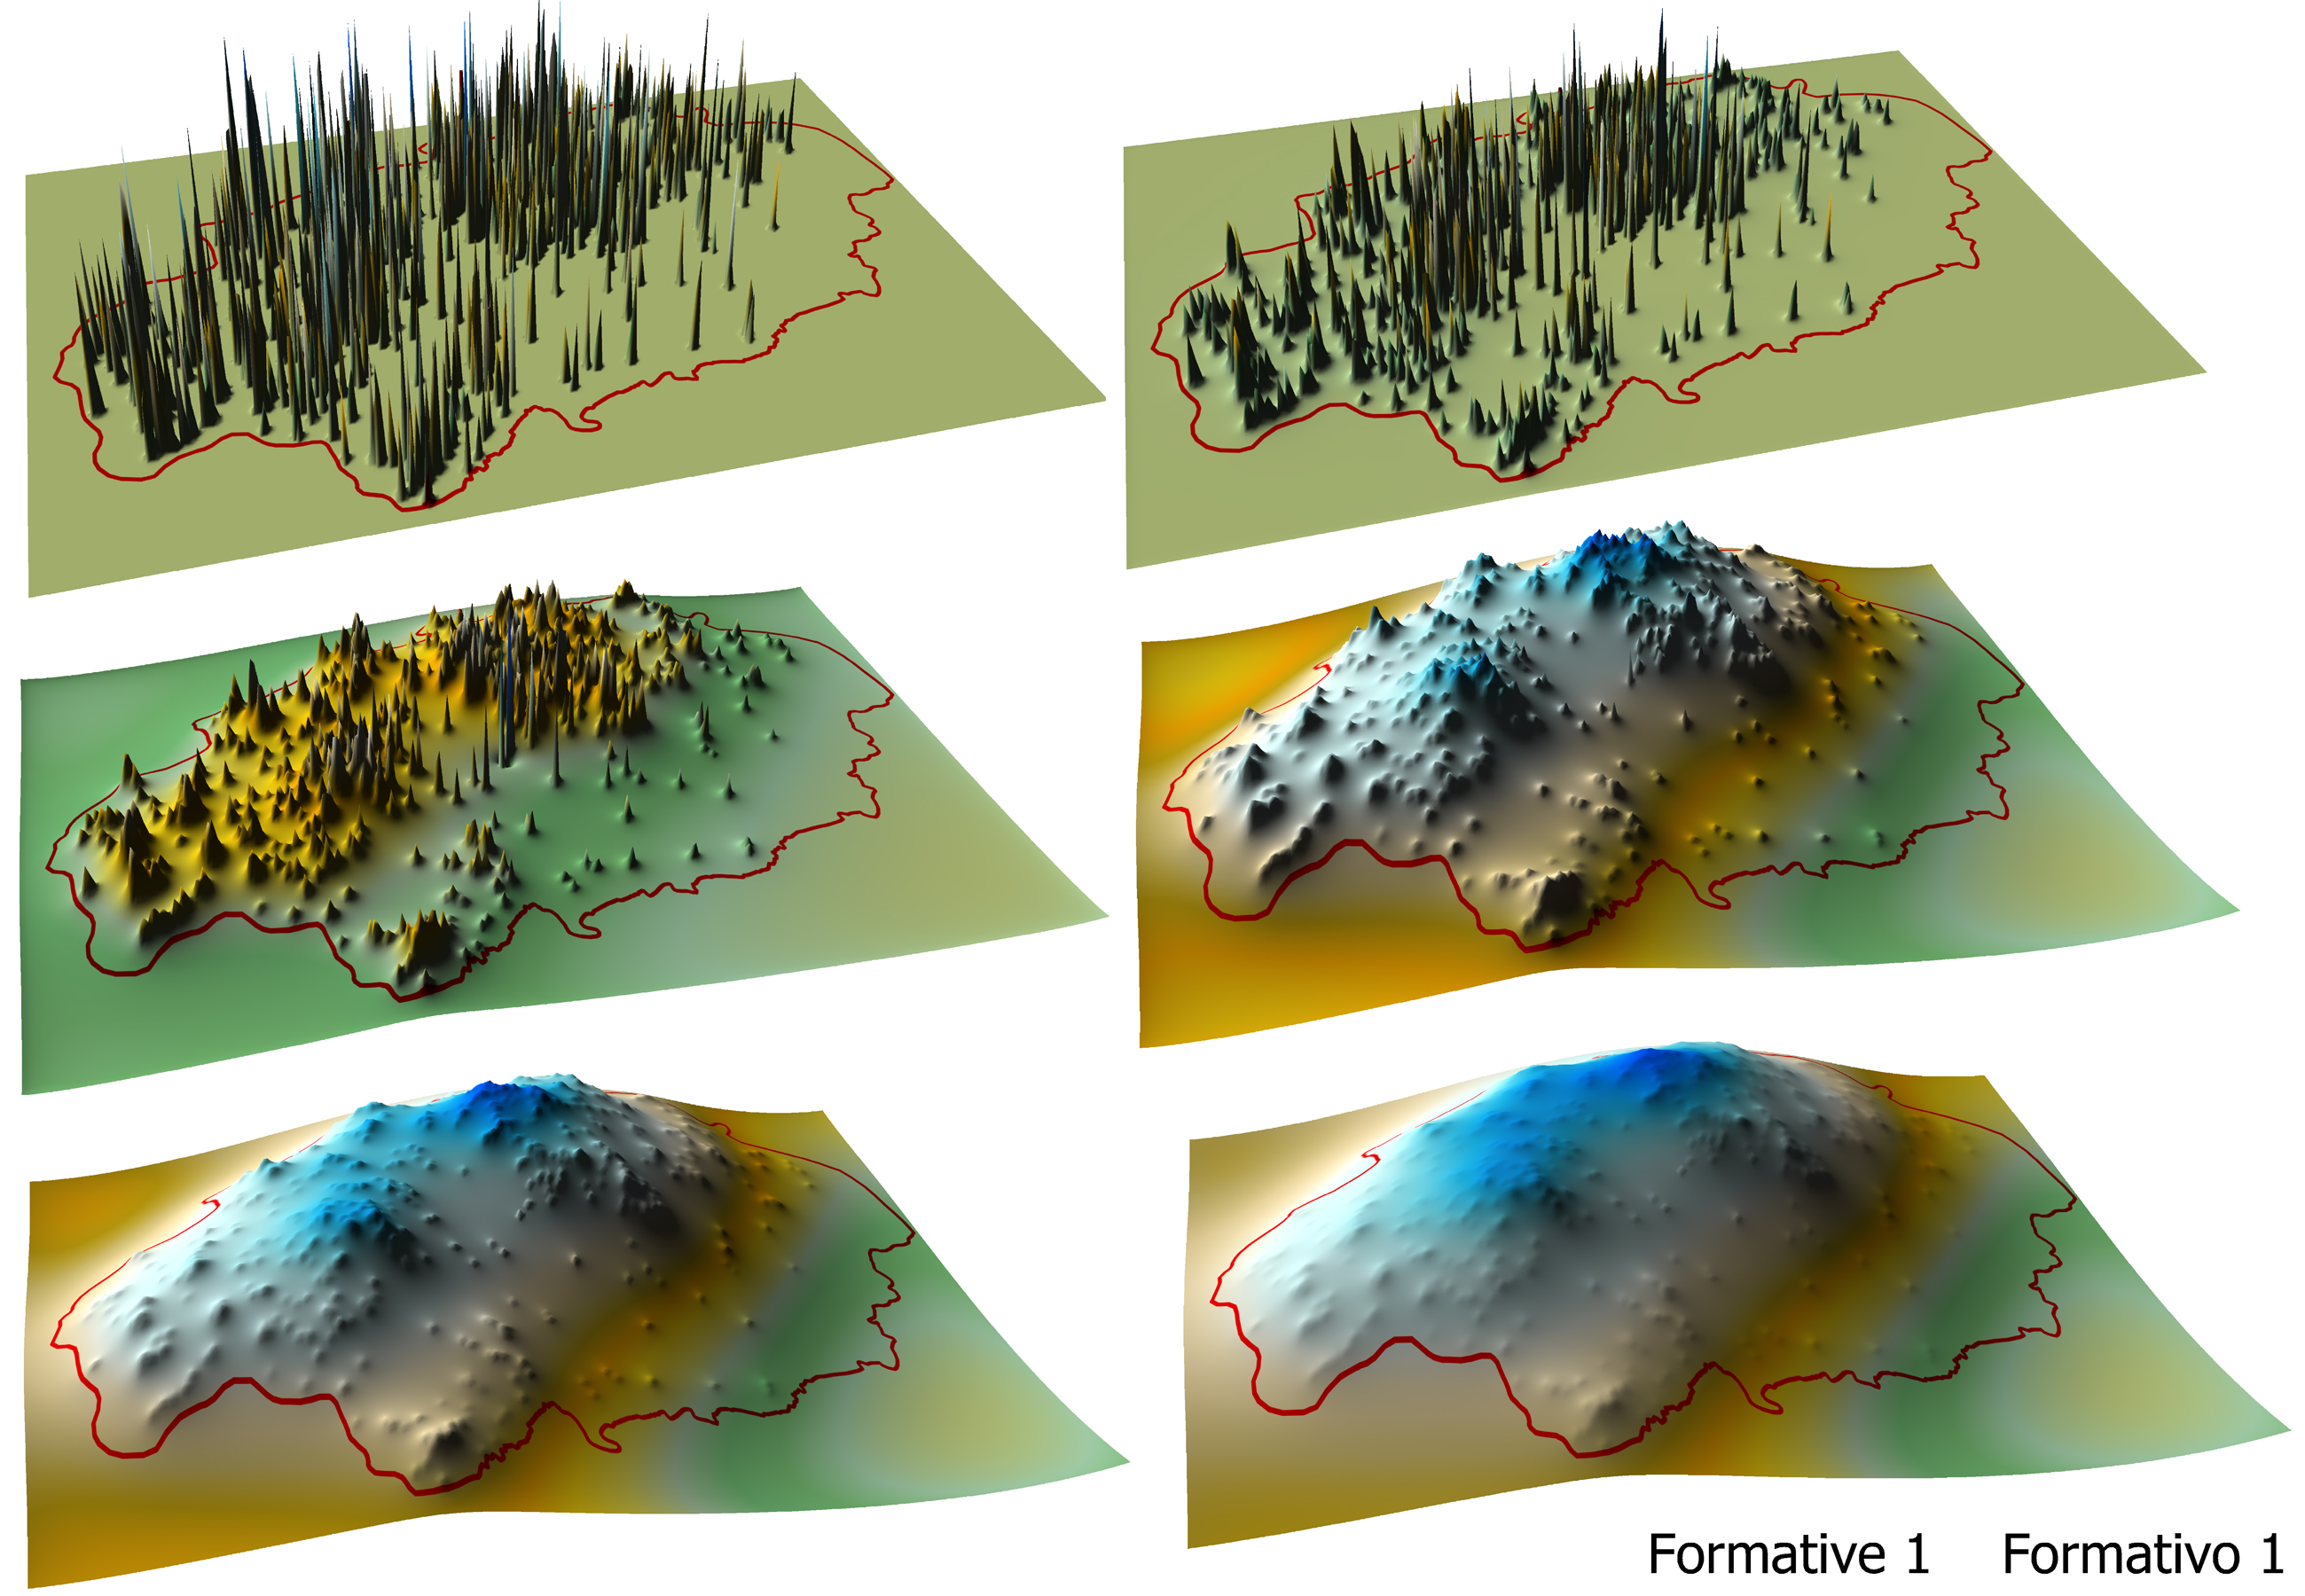
Fig. 4.2.Increasingly smoothed surfaces representing the Formative 1 occupation in the San Agustín-Isnos survey zone. Inverse distance powers used in the smoothing were (from top left to bottom right) 4, 2, 1, .5, .25, and .001.
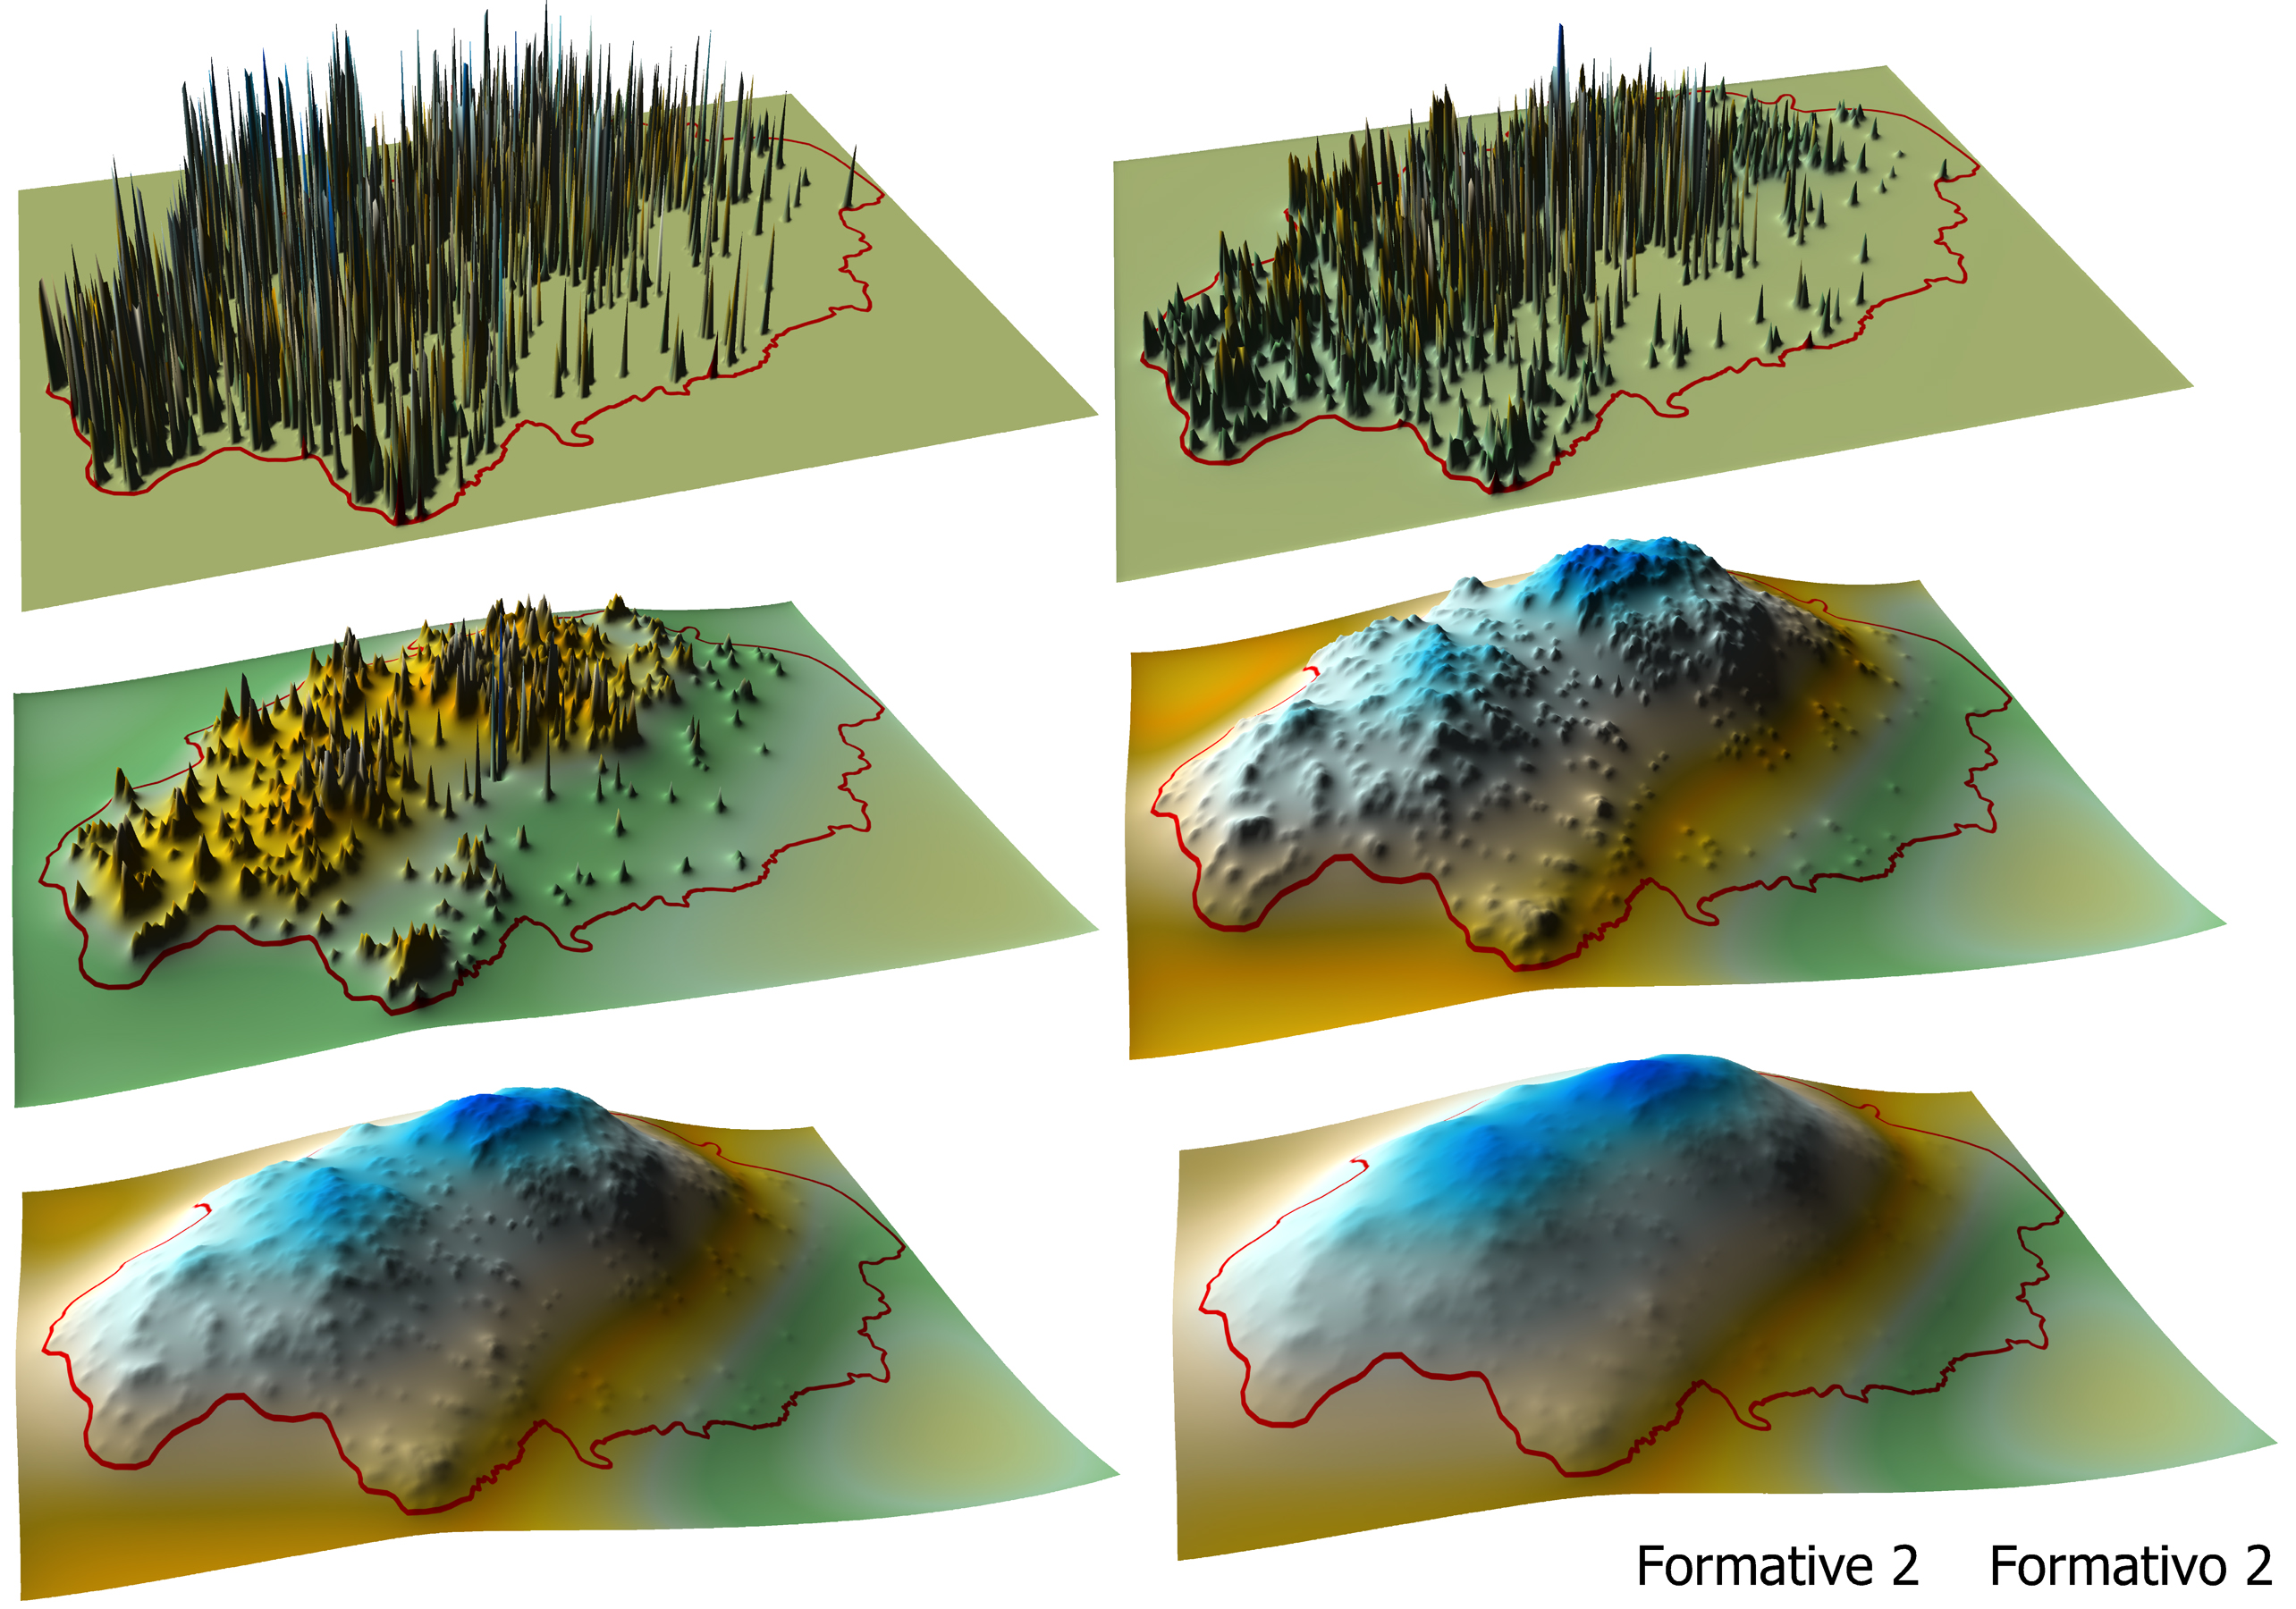
Fig. 4.8. Increasingly smoothed surfaces representing the Formative 2 occupation in the San Agustín-Isnos survey zone. Inverse distance powers used in the smoothing were (from top left to bottom right) 4, 2, 1, .5, .25, and .001.
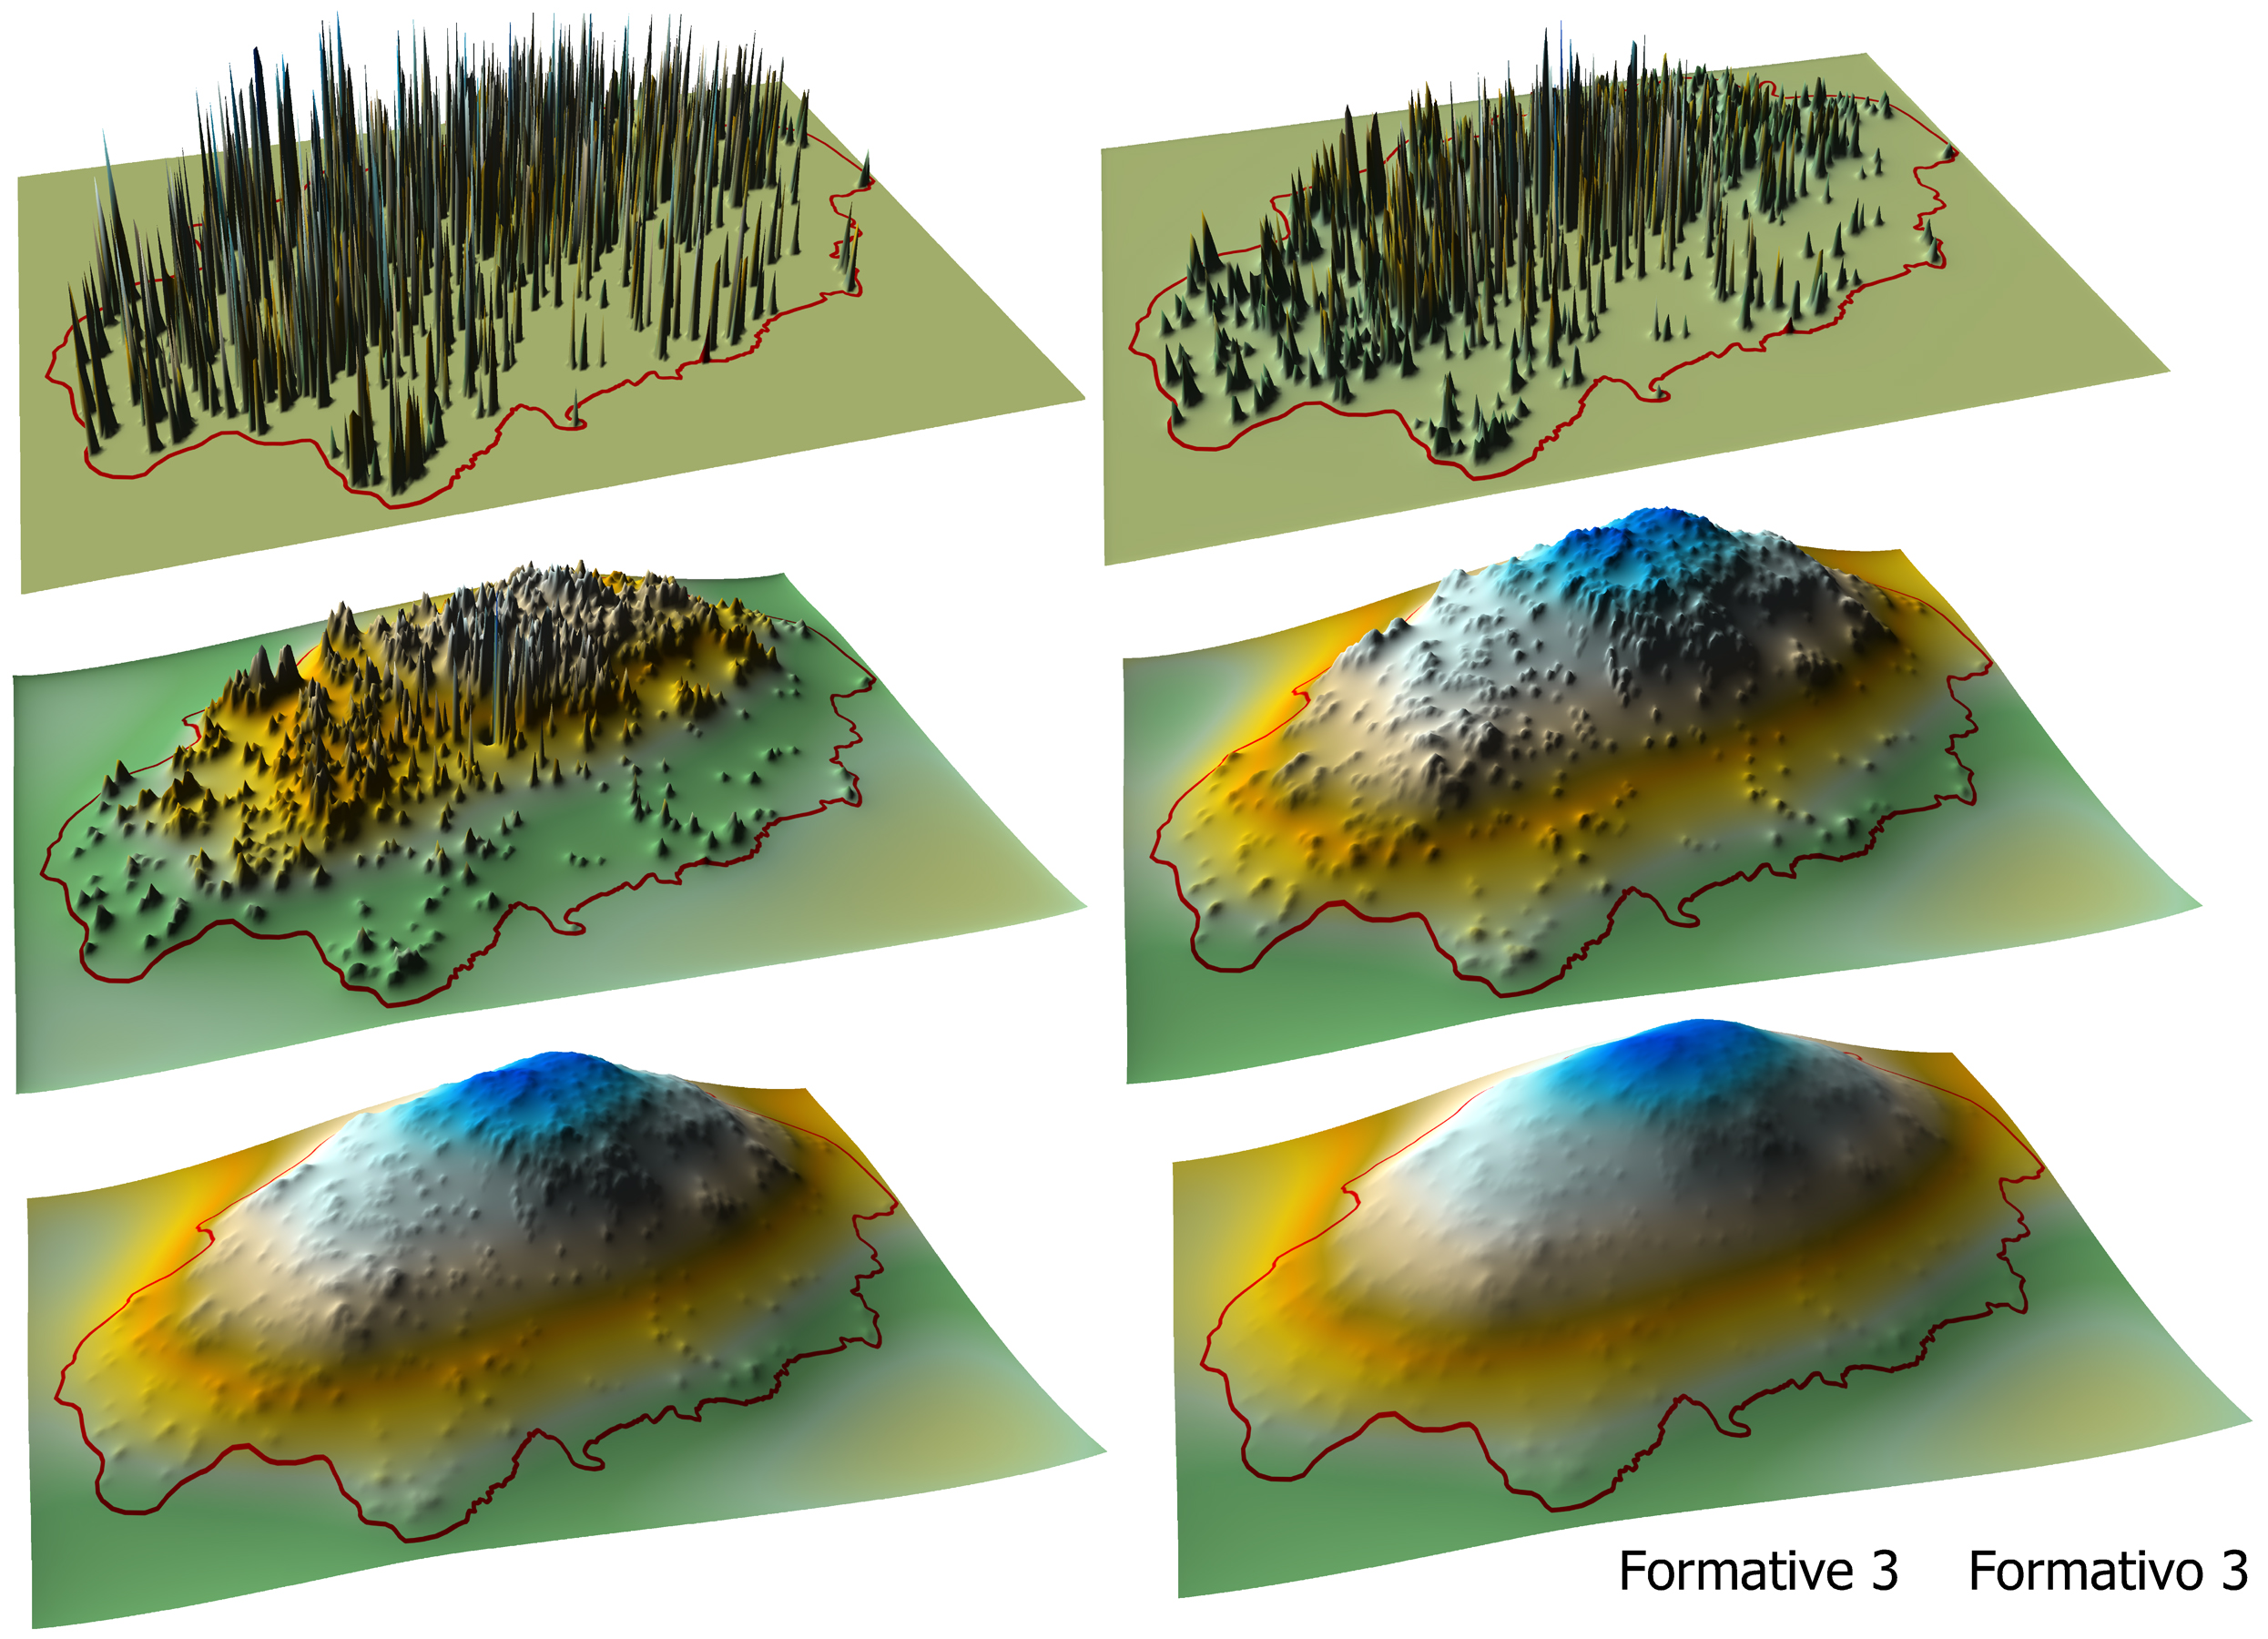
Fig. 4.13. Increasingly smoothed surfaces representing the Formative 3 occupation in the San Agustín-Isnos survey zone. Inverse distance powers used in the smoothing were (from top left to bottom right) 4, 2, 1, .5, .25, and .001.
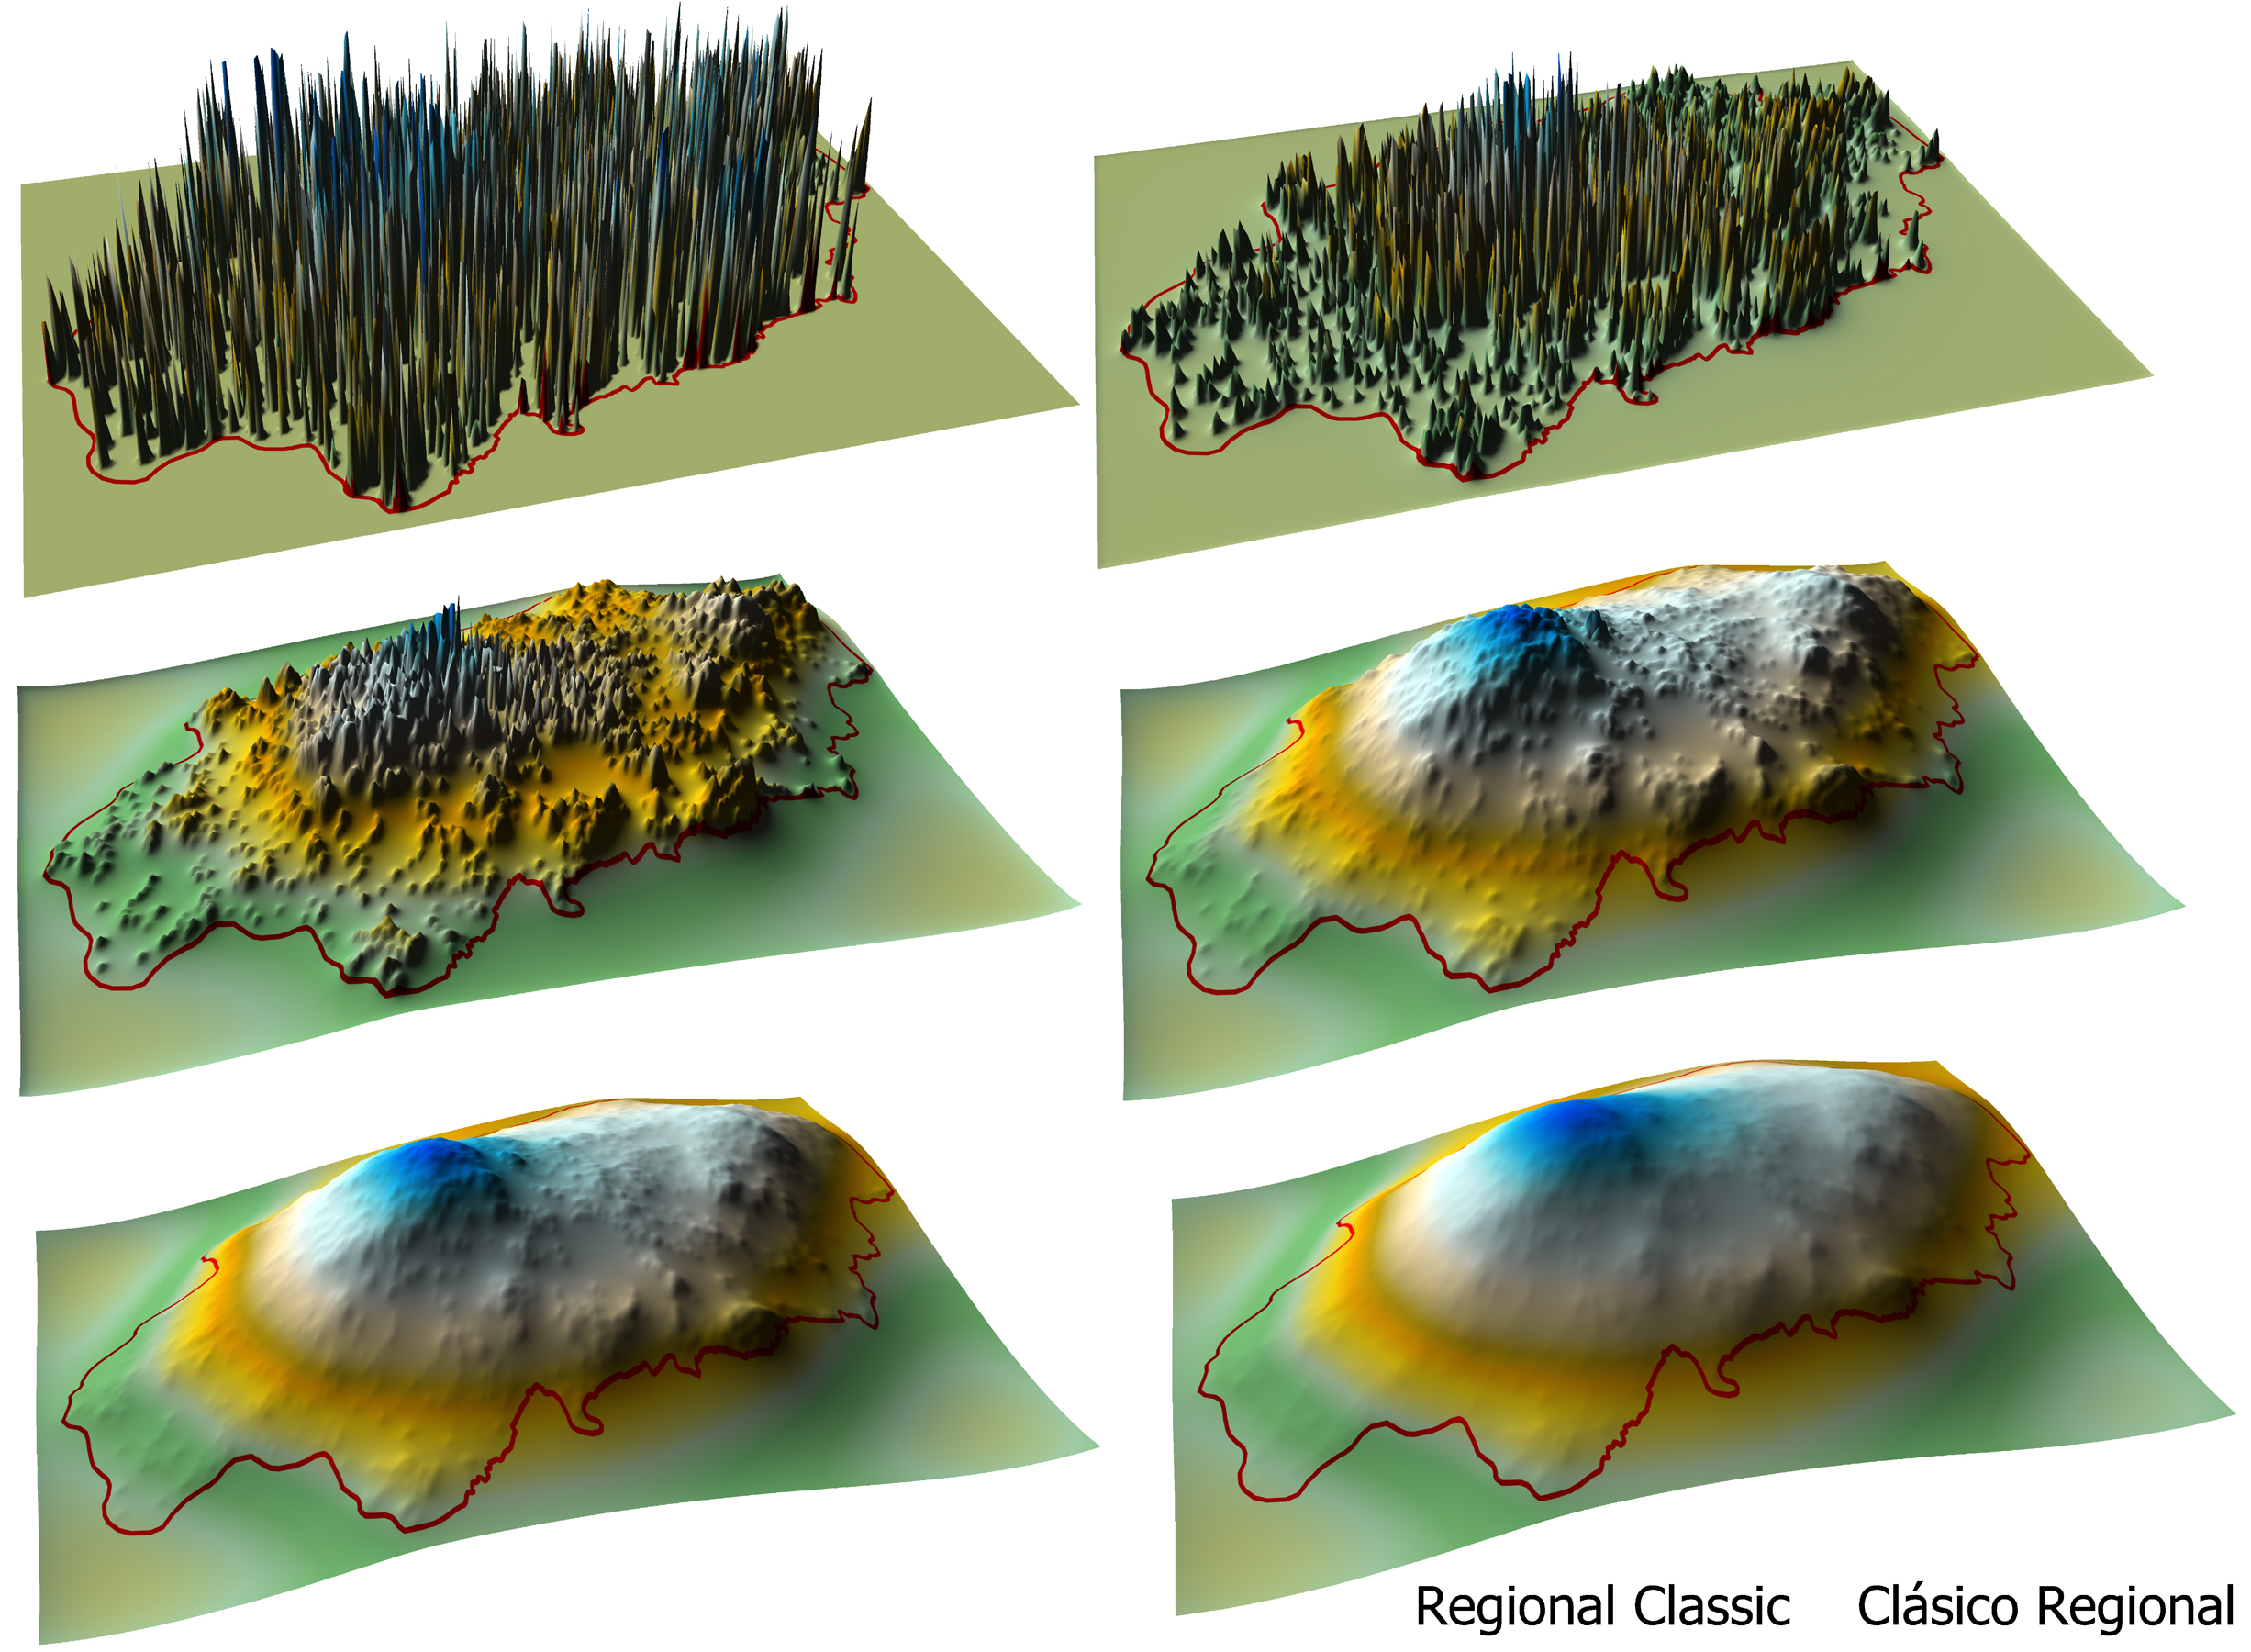
Fig. 5.2. Increasingly smoothed surfaces representing the Regional Classic occupation in the San Agustín-Isnos survey zone. Inverse distance powers used in the smoothing were (from top left to bottom right) 4, 2, 1, .5, .25, and .001.
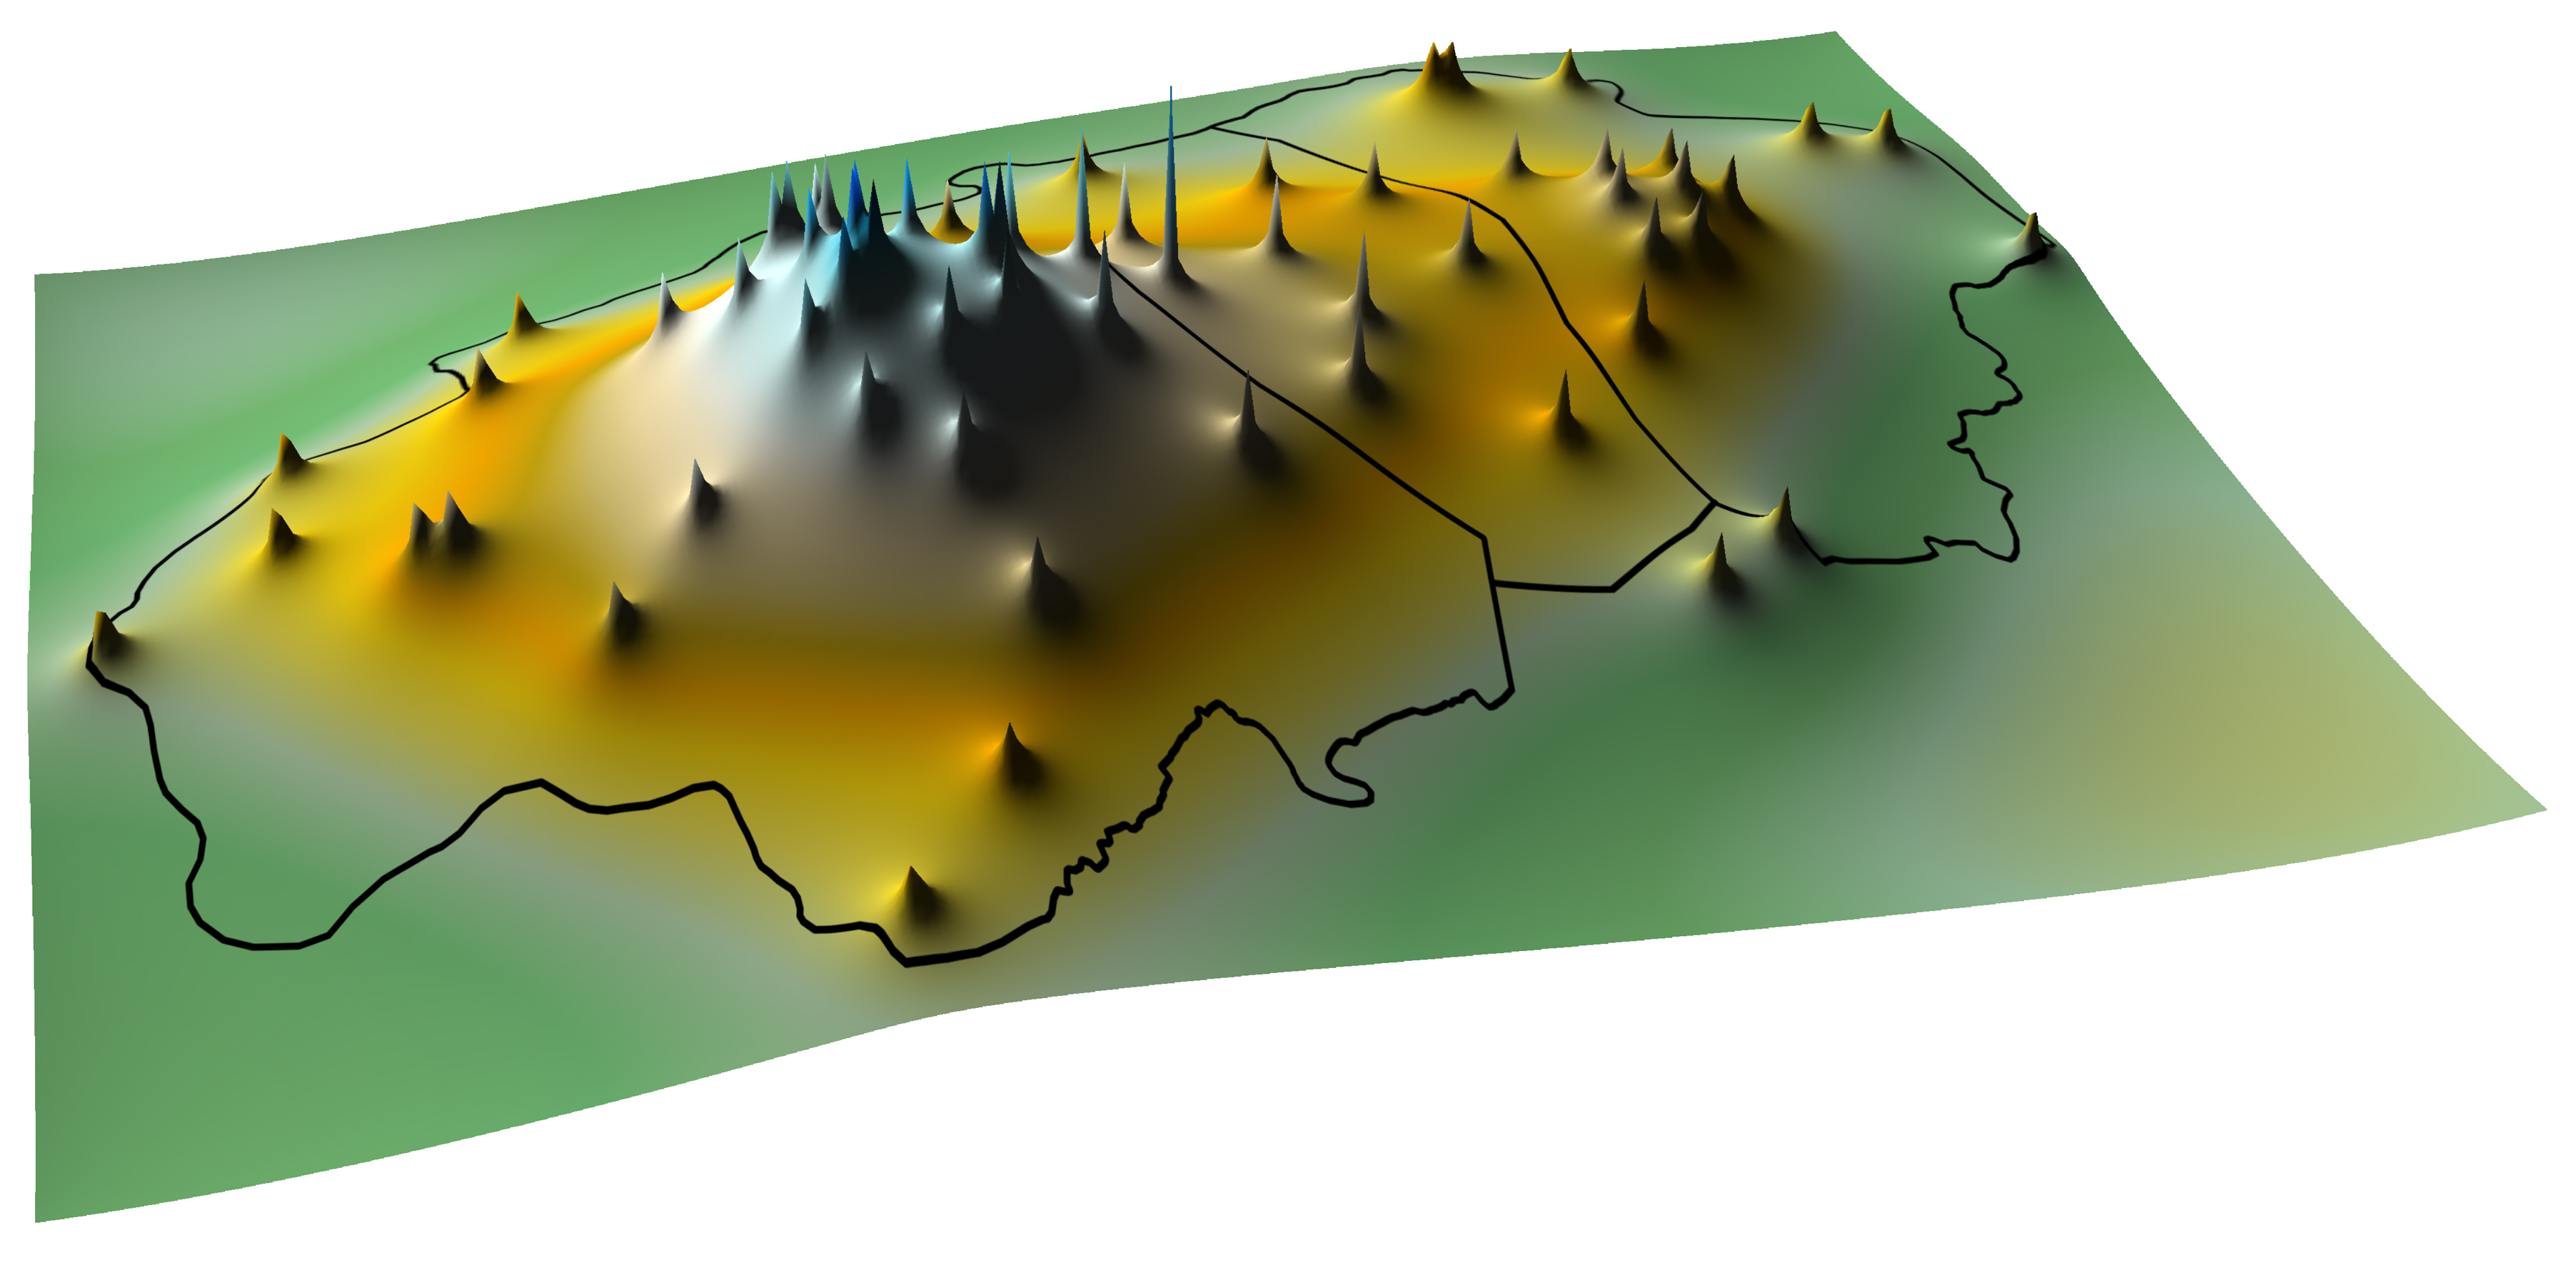
Fig. 5.13. Smoothed surface representing regional trends in the distribution of funerary monuments. Lines represent approximate boundaries of the western, eastern, and far eastern population clusters during the Regional Classic.
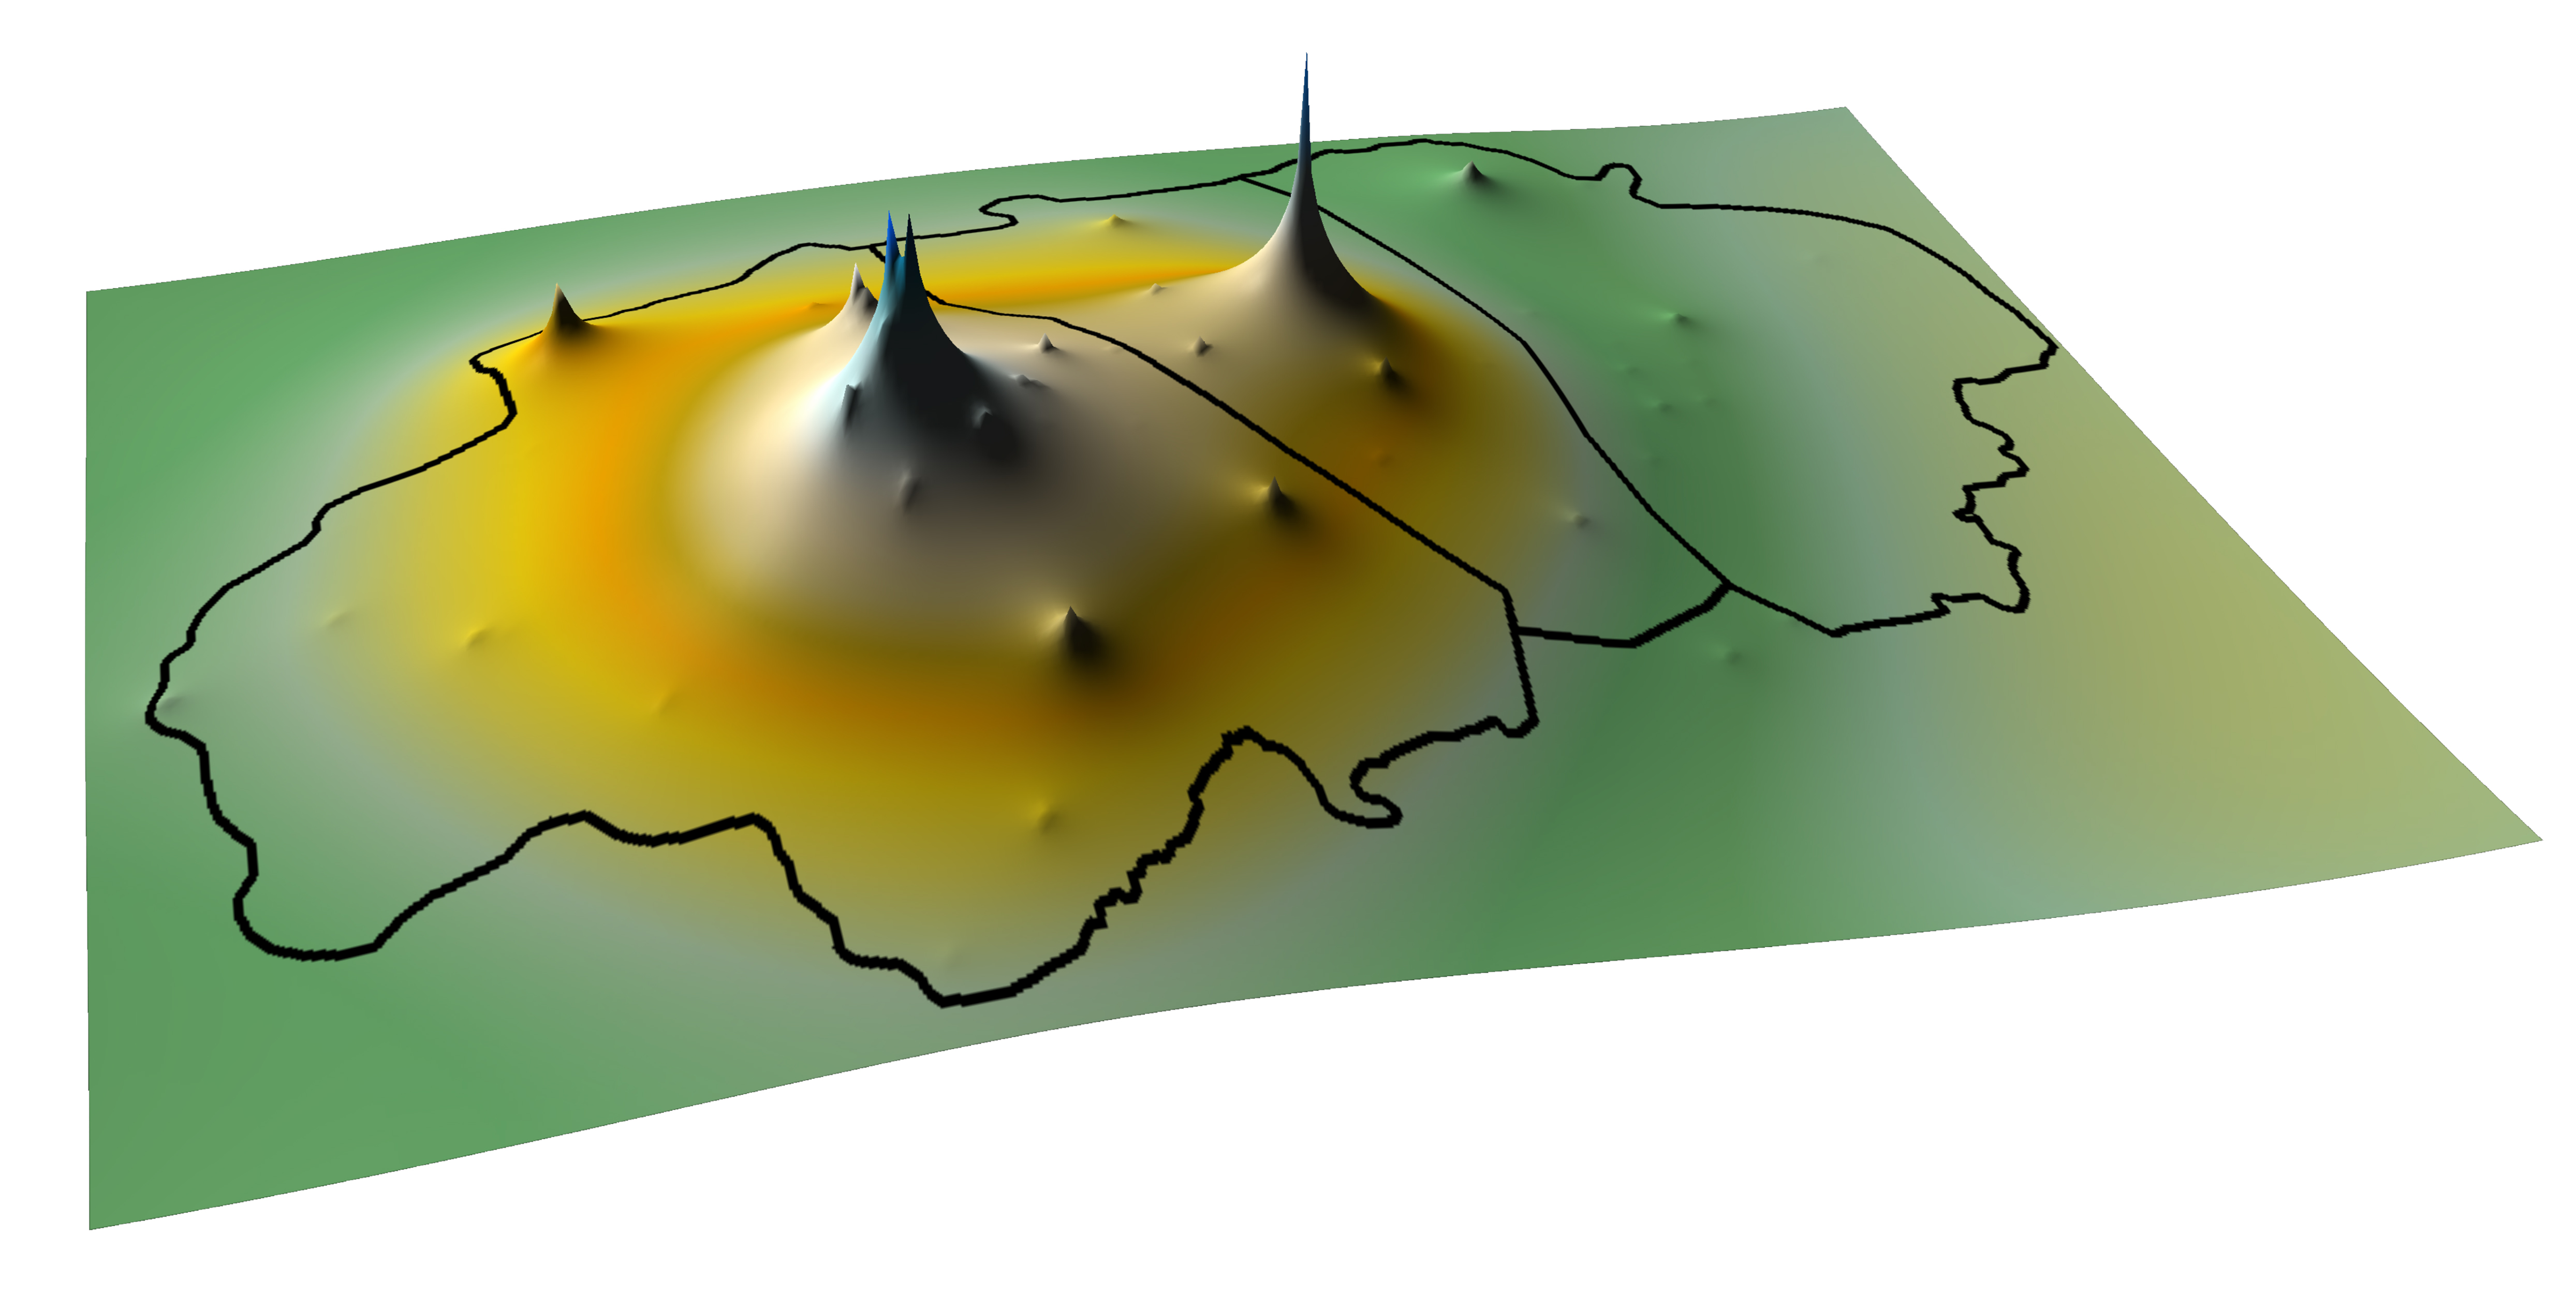
Fig. 5.15. Smoothed surface representing regional trends in the distribution of labor invested in funerary monuments. Lines represent approximate boundaries of the western, eastern, and far eastern population clusters during the Regional Classic.

Fig. 5.19. Smoothed surfaces representing regional-scale trends in population distribution (left) and decorated ceramics distribution (right) for the Regional Classic in the San Agustín-Isnos survey zone.
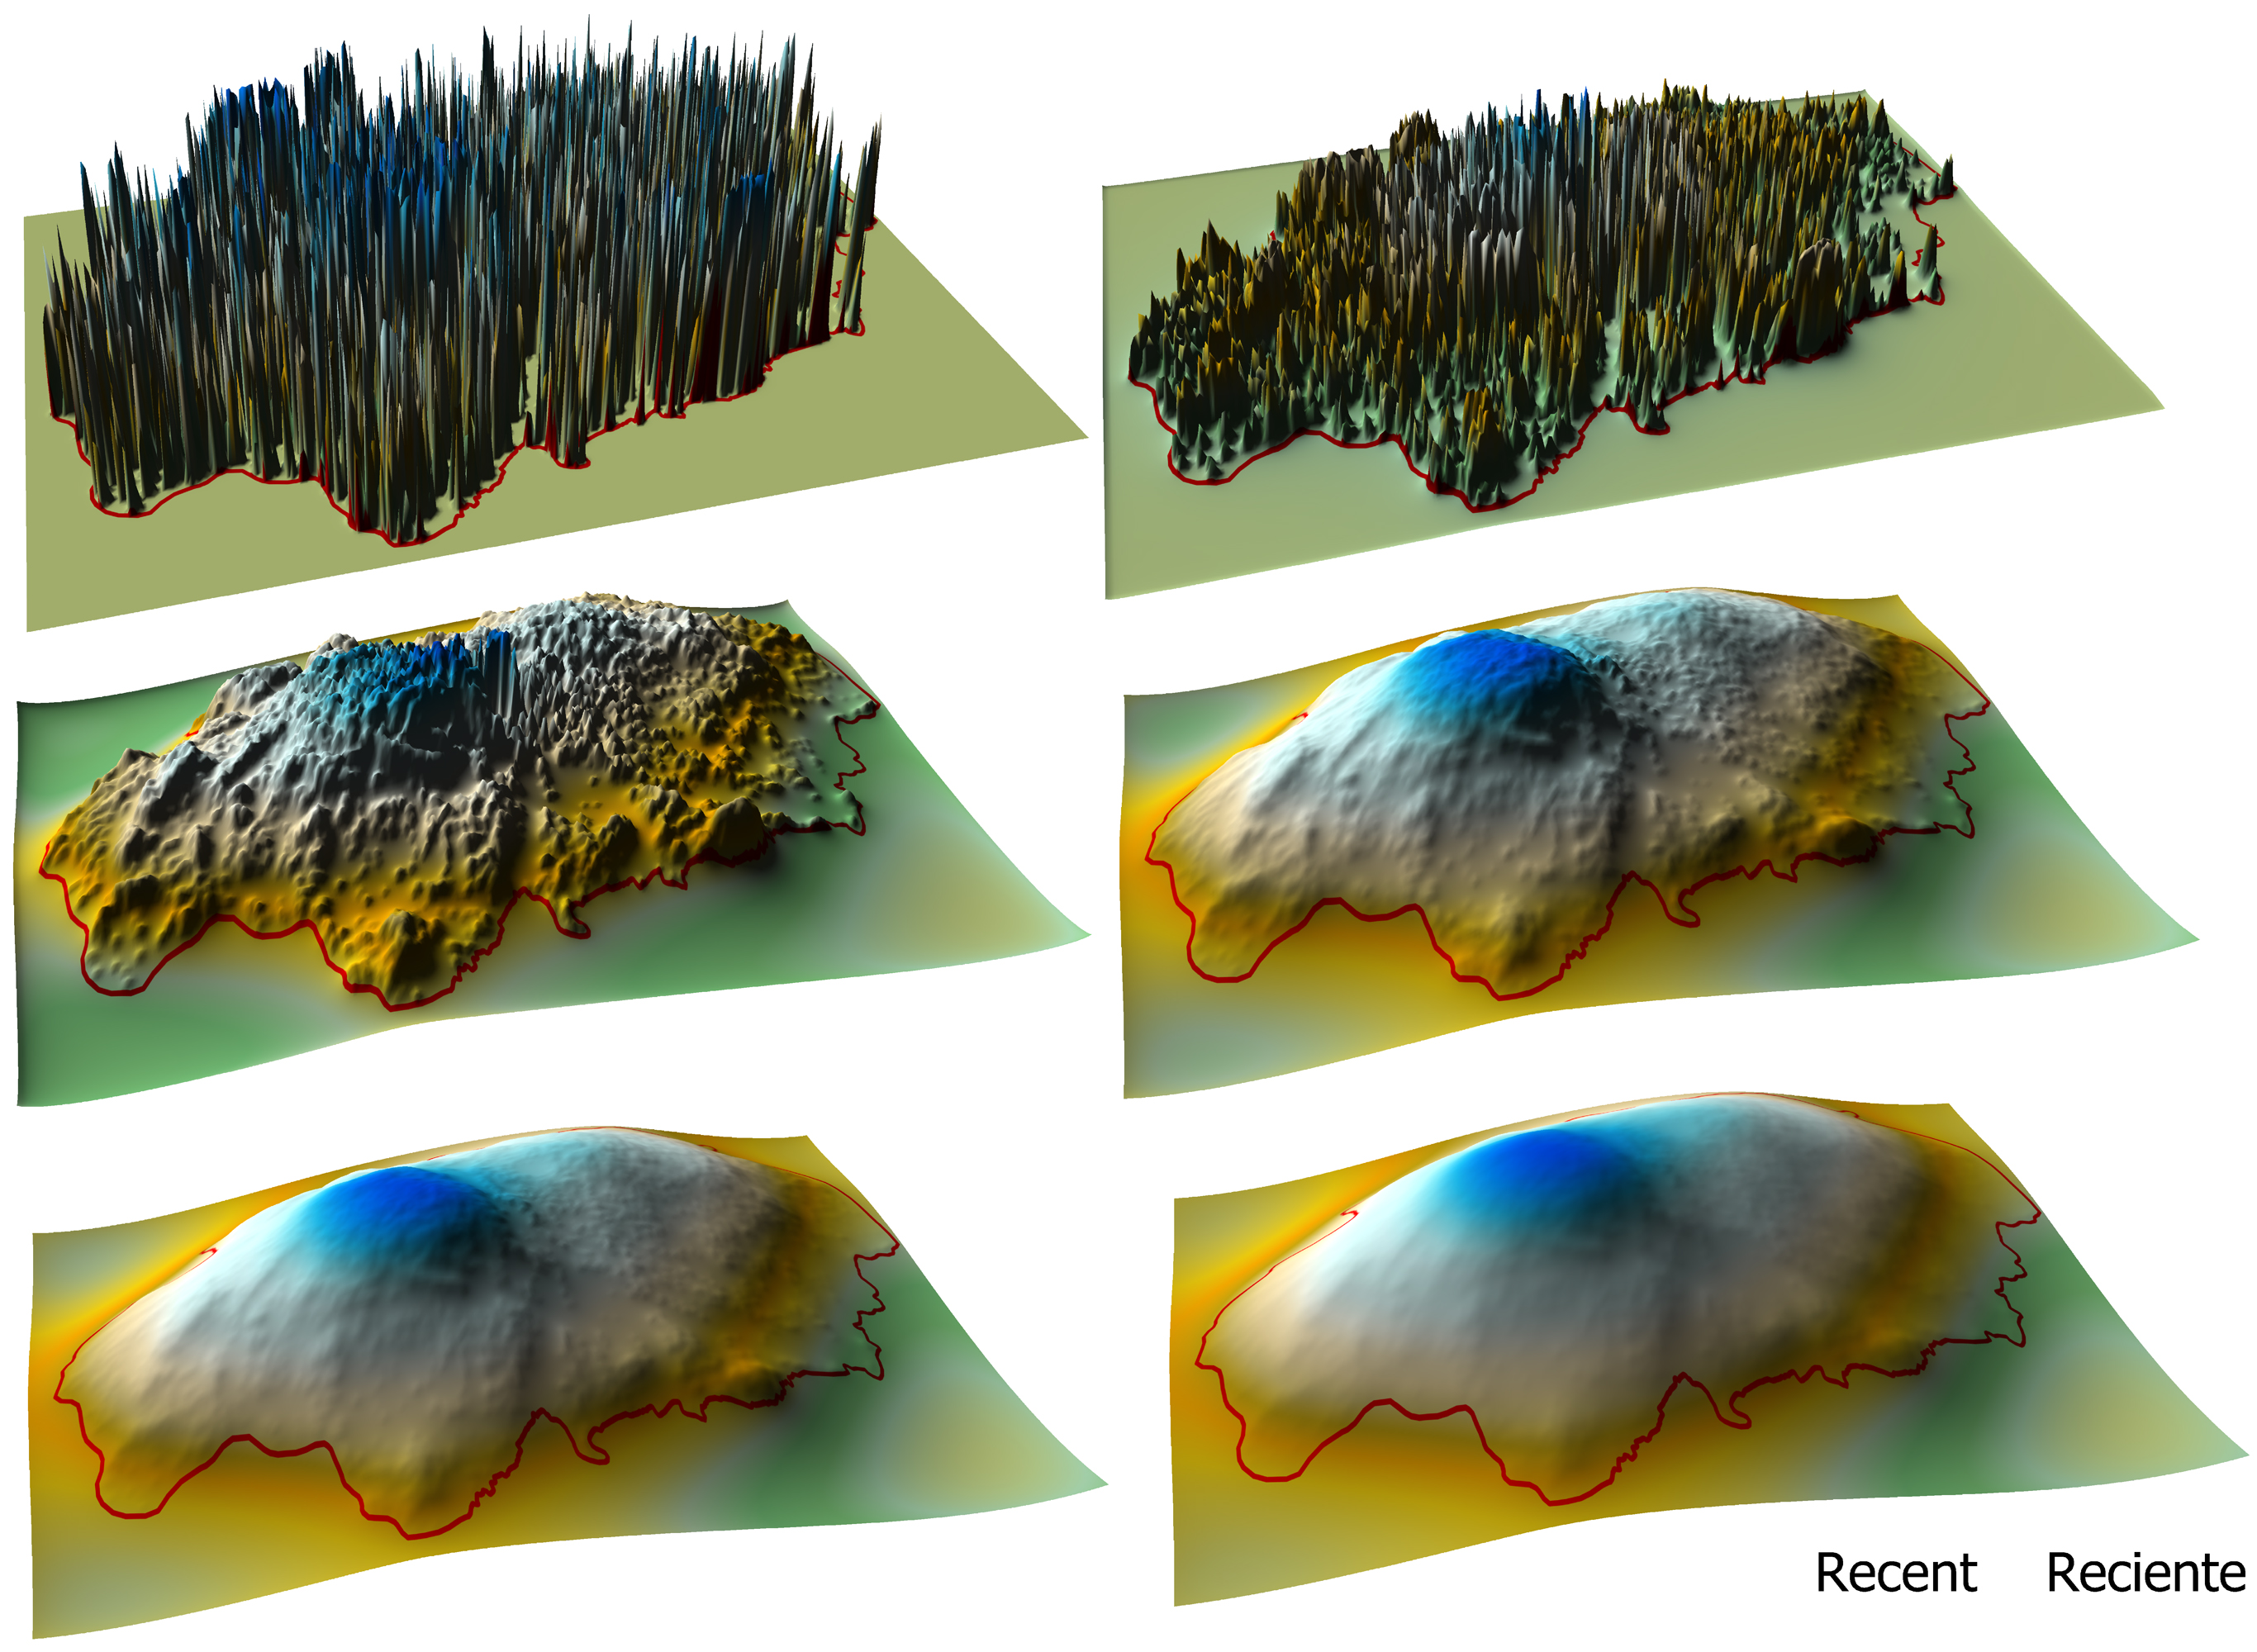
Fig. 6.02. Increasingly smoothed surfaces representing the Recent occupation in the San Agustín-Isnos survey zone. Inverse distance powers used in the smoothing were (from top left to bottom right) 4, 2, 1, .5, .25, and .001.