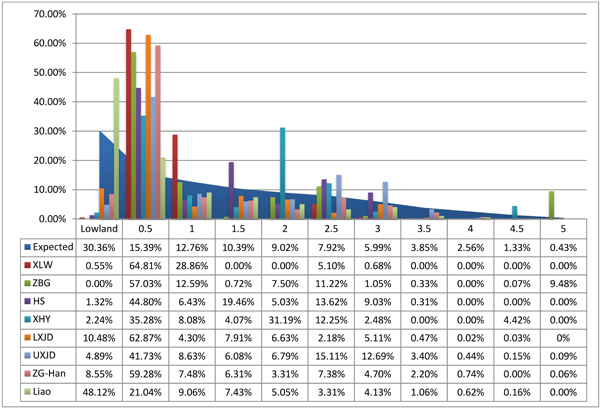
Fig. 4.39. Proportion of the regional population in buffers of 0.5 km around the lowlands.
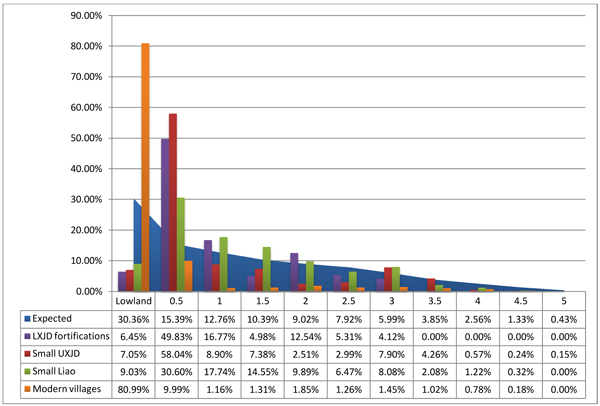
Fig. 4.40. Proportion of population in buffers of 0.5 km around the lowlands for fortified Lower Xiajiadian sites, for Upper Xiajiadian sites excluding the larger towns, and for Liao excluding the Songshanzhou site.
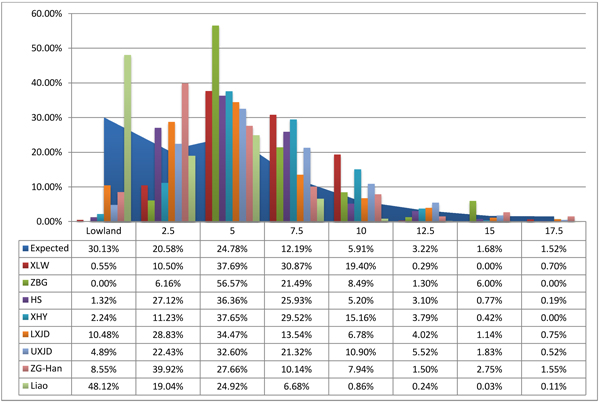
Fig. 4.42. Proportion of regional population on slopes of different steepness.
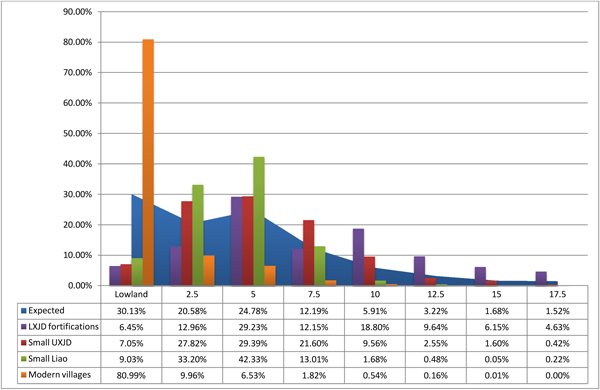
Fig. 4.43. Proportion of population on slopes of different steepness for fortified Lower Xiajiadian sites, for Upper Xiajiadian population excluding the larger towns, and for Liao population excluding Songshanzhou.
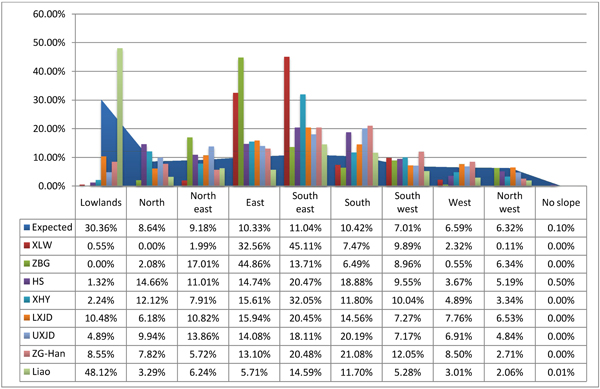
Fig. 4.45. Proportion of regional population on slopes of different aspects.
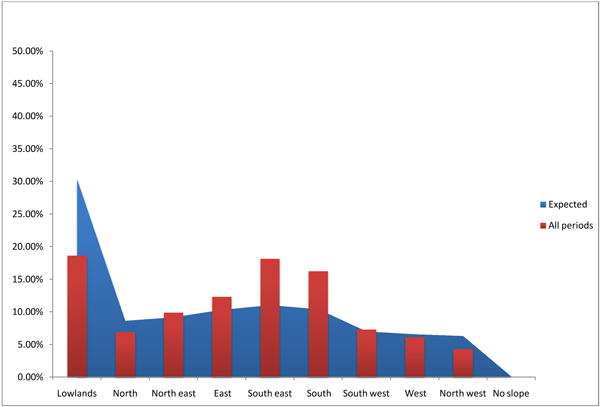
Fig. 4.46. Proportion of regional population for all periods on slopes of different aspects.
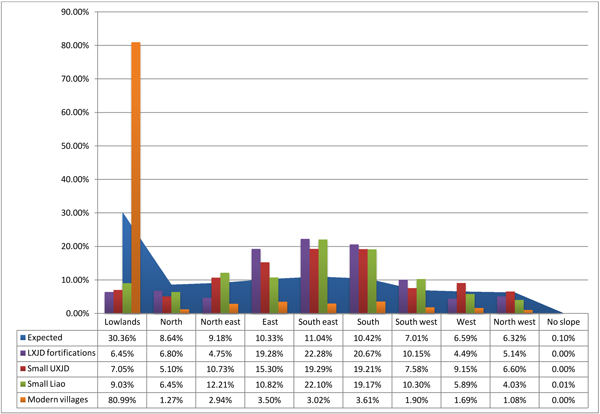
Fig. 4.47. Proportion of population on slopes of different aspects for fortified Lower Xiajiadian sites, for Upper Xiajiadian sites excluding the larger towns, and for Liao excluding the Songshanzhou site.
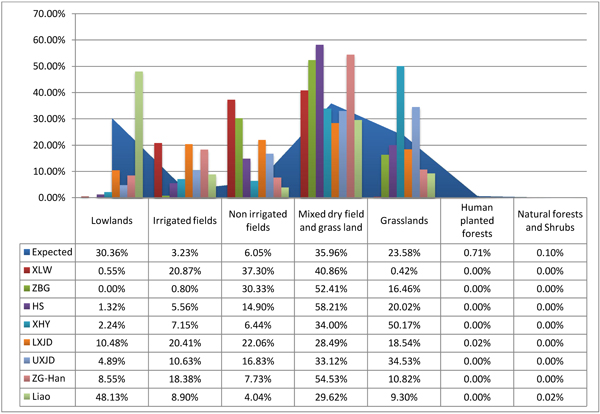
Fig. 4.49. Proportion of regional population on different modern land use zones.
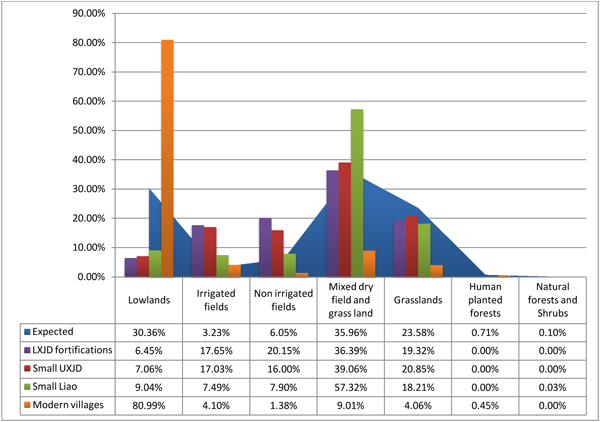
Fig. 4.50. Proportion of population on modern land use zones for fortified Lower Xiajiadian sites, for Upper Xiajiadian sites excluding the larger towns, and for Liao excluding the Songshanzhou site.
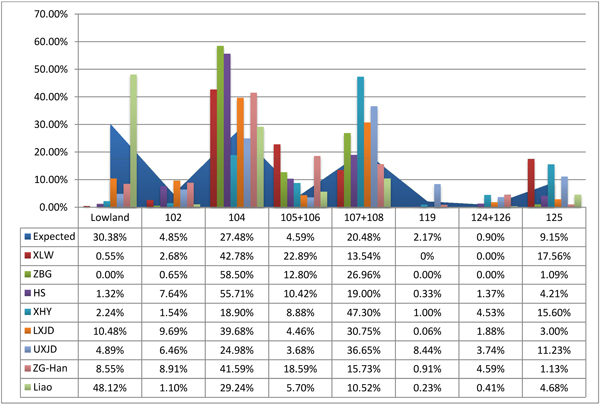
Fig. 4.52. Proportion of regional population on different geological zones.
102=Holocene alluvium;
104=Pleistocene alluvium;
105+106=Tertiary and Cretaceous sandstone and mudstone;
107+108=Cretaceous and Jurassic volcanic rock;
119=Archaean (pre-Cambrian) metamorphic rock;
124+126=Jurassic porphyry;
125=Jurassic granite.
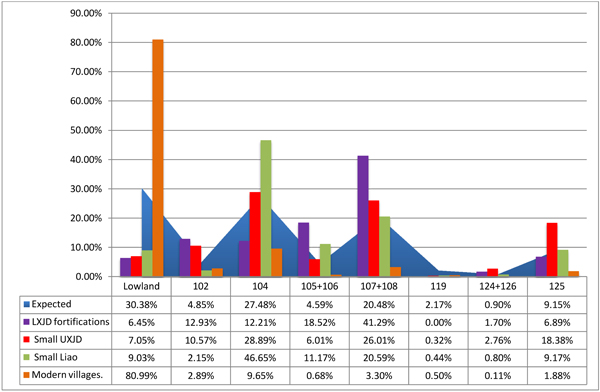
Fig. 4.53. Proportion of population on different geological zones for fortified Lower Xiajiadian sites, for Upper Xiajiadian sites excluding the larger towns, and for Liao excluding the Songshanzhou site.